
Disclosure
TradeVulcan develops and sells AI-enabled workflow software for home service contractors. The market, housing and labor sections of this report are based on cited third-party sources. The section describing TradeVulcan’s role and the $300,000-to-$2 million contractor opportunity is explicitly labeled as the company’s perspective, not an independently measured industry finding.
Forecast window and an important market-size warning
This report covers the U.S. home services operating environment for October through December 2026. It is a directional business forecast, not a guarantee of national or local revenue.
The headline figures in this article measure different markets. Marketdata’s $543 billion estimate covers nine broad home-maintenance service categories, including HVAC and plumbing, landscaping, roofing, electrical, pest control, cleaning, appliance repair and home security. Harvard’s remodeling estimate measures improvements and repairs to owner-occupied homes. Those numbers should not be added together or treated as competing estimates of the same activity.
The Q4 operating picture
Home services enter the fourth quarter with a durable demand floor but a less forgiving sales environment.
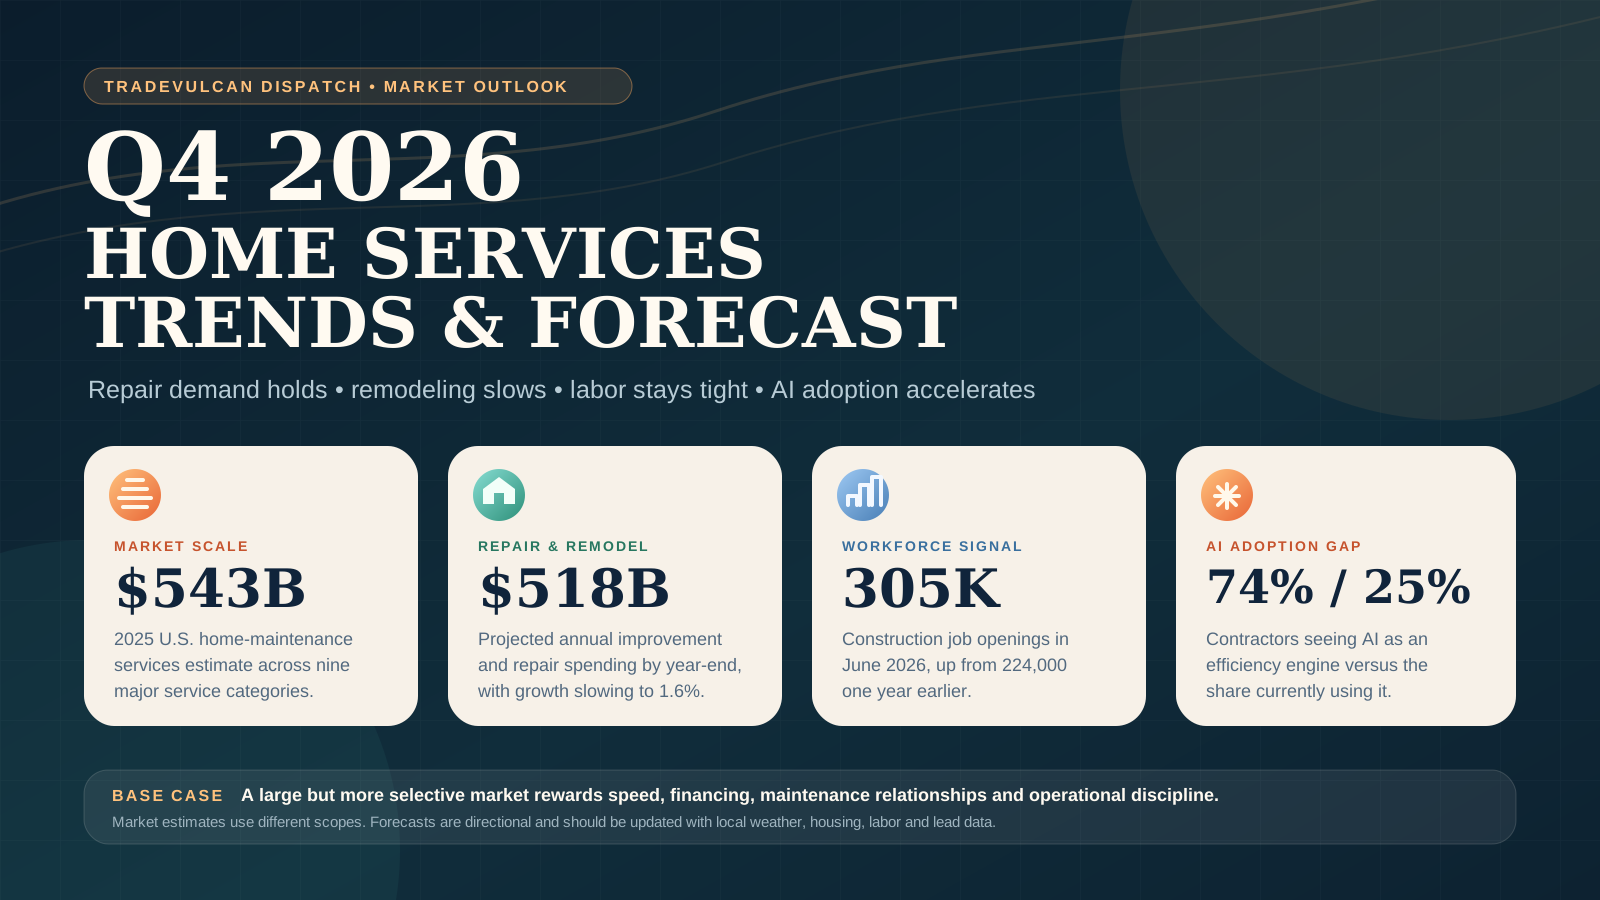
The industry remains enormous and structurally fragmented. Marketdata estimates that the nine-category U.S. home maintenance services market reached $543 billion in 2025 and forecasts 5.3% annual growth through 2030. Yet the near-term pace is softer than the long-term market story: Harvard’s Leading Indicator of Remodeling Activity projects improvement and repair spending growth slowing to 1.6% by the end of 2026 and only 0.5% by the second quarter of 2027.
That combination points to a repair-led Q4. Homeowners are still spending, especially on systems that fail, leak, trip, stop heating or create an immediate safety problem. They are more likely to delay, reduce scope, seek more quotes or ask for financing on discretionary work. Contractors therefore cannot rely on market size alone. Speed, trust, financing, follow-up, recurring maintenance relationships and operational execution become more important.
Labor remains the binding constraint. Construction added 22,000 jobs in July, but June still showed 305,000 job openings—81,000 more than a year earlier—while construction wage growth remained above 4% year over year. At the same time, AI adoption is accelerating because model capability has improved and one major component of cost, inference, has fallen dramatically. The Q4 opportunity is not replacing technicians. It is using automation to protect the scarce labor hours contractors already have.
Q4 2026 home services forecast: eight takeaways
- Essential repair and replacement demand should remain more resilient than discretionary remodeling, especially for HVAC, plumbing, electrical, roofing and appliance failures.
- The market is large, but growth is decelerating. Contractors should expect more price sensitivity, scope reductions, quote comparison and financing conversations.
- Homeowners staying in older homes create a durable maintenance base: a 2026 Housecall Pro survey found 72% planned to stay put and 69% lived in homes more than 20 years old.
- Response speed is a revenue lever. In the same homeowner survey, 72% said they would pay more for an emergency resolved within 24 hours.
- Construction hiring should remain positive but difficult. Openings are elevated, hiring is not keeping pace with the year-ago level, and wages continue to rise.
- AI adoption will broaden from content generation into customer communication, booking, estimating support, follow-up, reporting and workflow orchestration.
- The AI advantage will favor companies that connect tools to measurable workflows rather than adding disconnected chatbots or generic assistants.
- Smaller contractors can now buy the same categories of automation once associated mainly with larger enterprises, but implementation quality, data, training, consent and human oversight still determine results.
Q4 contractor market dashboard
- Broad market estimate
- $543B
- Year-end remodel pace
- 1.6%
- Construction openings
- 305K
- AI interest / use
- 74% / 25%
Marketdata’s estimate for nine U.S. home-maintenance service categories in 2025; forecast at 5.3% annual growth through 2030.
Harvard JCHS projection for year-over-year growth in owner-occupied improvement and repair spending by the end of 2026.
Seasonally adjusted construction job openings in June 2026, up from 224,000 in June 2025.
ServiceTitan residential-contractor survey: 74% view AI as an efficiency engine, while about 25% currently use it.
A $543 billion market can still have a slow quarter
The home services industry’s long-run case remains strong. The housing stock is aging. Homeowners continue to outsource specialized work. Many service categories are local, recurring and difficult to digitize away because the physical work still has to happen in the home.
Marketdata’s report describes a fragmented market populated mainly by small local contractors and service providers, alongside a meaningful franchise presence. It estimates a 2025 market value of $543 billion and forecasts 5.3% annual growth through 2030. HVAC and plumbing together account for roughly 26% of the report’s market scope, while landscaping represents roughly 25%.
The Q4 caution is that a long-term compound-growth forecast is not a quarterly sales forecast. Harvard JCHS expects owner-occupied improvement and repair spending to reach approximately $518 billion by the end of 2026, but year-over-year growth is projected to ease to 1.6%. Its July update projects only 0.5% growth by the second quarter of 2027, citing flat permitting and building-product retail activity, reduced housing starts and broader economic uncertainty.
NAHB’s second-quarter Remodeling Market Index provides a useful counterweight: its reading of 61 remains positive, meaning more remodelers described conditions as good than poor. The message is not collapse. It is deceleration and selectivity.
Q4 demand by project type
| Project type | Q4 base-case bias | Why | Contractor implication |
|---|---|---|---|
| Emergency repair | Resilient to strong | Heating failures, leaks, outages, unsafe electrical conditions and active roof intrusion are difficult to defer | Protect after-hours coverage, rapid triage, routing, parts visibility and first-response speed |
| System replacement | Stable but financing-sensitive | Aging equipment creates need, while higher project cost creates quote comparison and payment friction | Present options clearly, offer compliant financing pathways and maintain disciplined estimate follow-up |
| Recurring maintenance | Stable | Older homes and stay-put homeowners support preventive work and membership relationships | Use seasonal campaigns, maintenance agreements and customer-history-based outreach |
| Large discretionary remodel | Slower and more selective | Remodeling growth is decelerating, mortgage rates remain elevated and economic uncertainty affects scope | Qualify budget earlier, offer phased scopes and manage backlog and deposits tightly |
| Small improvement project | Mixed to stable | Smaller scopes are easier to fund but still face price comparison and postponement | Make estimates easy to understand and reduce friction between inquiry, visit and approval |
| Storm restoration | Event-driven | Demand depends on actual wind, hail, wildfire and flood events rather than the broad economic cycle | Maintain licensing, safety, documentation, temporary-repair and surge-capacity plans |
| Cleaning, pest and seasonal exterior work | Mixed by region and service | Holiday activity, rodent pressure, fall cleanup, irrigation winterization and snow preparation create seasonal pockets | Segment campaigns by climate, customer history and service interval instead of sending one national message |
Housing turnover is still restrained, which keeps homeowners focused on the house they already own
June existing-home sales ran at a seasonally adjusted annual rate of 4.09 million, down 2.4% from May but up 2.8% from a year earlier. Inventory equaled 4.6 months of supply and the median existing-home price reached $440,600.
Mortgage rates remain a meaningful restraint on mobility. Freddie Mac’s August 20 survey put the average 30-year fixed rate at 6.65%. Many existing homeowners still carry mortgages originated at lower rates, which creates a practical incentive to stay in place rather than trade into a more expensive loan.
That does not automatically translate into a remodeling boom. It does support maintenance, repair and selective upgrading of the existing home. The operating distinction matters: a homeowner may defer a kitchen redesign while still replacing a failed water heater, repairing a panel, addressing a roof leak or financing an HVAC replacement.
The homeowner is still buying—but with more friction
Housecall Pro’s 2026 homeowner survey provides a useful directional picture of the Q4 buyer. Nearly all respondents planned to spend on their homes during 2026, and 79% expected at least one system repair or replacement. More than half expected to spend over $3,000, while one-third anticipated more than $7,500.
The same survey shows why lead volume alone is not enough. Seventy-seven percent said rising costs were causing them to delay or reduce project scope. Sixty-eight percent said a higher-than-expected estimate would push them to collect additional quotes. Fifty-one percent wait until a problem becomes worse, and 41% reported a delayed repair that ultimately cost more.
Financing and speed can change the decision. Sixty-two percent said payment plans would make them more likely to proceed, and 72% would pay more for an emergency resolved within 24 hours. These findings come from a survey of more than 1,100 homeowners and should be read as directional, not as a perfect population estimate.
What the Q4 homeowner data means at the point of sale
- Answer quickly and make the next step obvious; a delayed response gives a price-sensitive buyer more time to call competitors.
- Present good-better-best or repair-versus-replace paths without manufacturing urgency.
- Explain financing and payment options early enough to matter, while following lender and advertising requirements.
- Use photos, diagnostic evidence and plain-language scope descriptions to reduce distrust and quote-shopping friction.
- Follow up consistently on open estimates, especially when the customer is delaying rather than rejecting the work.
- Build maintenance and membership relationships before the emergency so the company is already trusted when a system fails.
- Track lost-job reasons by price, timing, financing, trust, availability and competitor—not merely won or lost.
Q4 forecast by home service trade
Trade-level operating outlook
| Trade | Q4 demand bias | Primary demand drivers | Best operating move | Main risk |
|---|---|---|---|---|
| HVAC | Stable to strong, weather-dependent | Heating tune-ups, no-heat calls, heat-pump performance, aging systems, IAQ and late cooling in warm markets | Transition capacity by local weather, preserve emergency coverage and follow up replacement estimates | A mild start to winter, parts constraints or shifting technicians away from service too early |
| Plumbing | Resilient | Water heaters, drains, leaks, sewer issues, holiday household load and freeze exposure in colder markets | Strengthen same-day triage, water-damage referral networks and customer-history campaigns | Price sensitivity on replacements and overloaded holiday/on-call schedules |
| Electrical | Stable to strong | Panel and service work, backup power, surge protection, heating electrification, EV charging and safety repairs | Prioritize licensed capacity, permit coordination and clear project sequencing with HVAC and generator work | Long lead times, inspections, utility coordination and scarce licensed labor |
| Roofing and exterior | Mixed, event-driven with repair floor | Leaks, fall inspections, winter preparation, storm damage, gutters, flashing and ventilation | Separate emergency stabilization from permanent scope and maintain documentation discipline | Weather access, insurance friction, storm-chasing compliance and slower elective replacement decisions |
| Remodeling and general contracting | Positive but decelerating | Stay-put homeowners, aging-in-place, equity and accumulated project backlog | Qualify financing and scope earlier, phase projects and protect schedule and deposit quality | Consumer caution, cost escalation and projects being reduced or postponed |
| Pest control | Stable with seasonal pockets | Rodent movement indoors, recurring service plans and climate-specific pest cycles | Use property and service-history triggers to renew recurring work before infestations escalate | Regional seasonality and high customer-acquisition cost for one-time work |
| Garage door | Stable | Mechanical failure, safety, weather sealing, security and holiday household activity | Emphasize rapid diagnosis, parts readiness and repair-versus-replace clarity | Commoditized lead markets and price comparison |
| Painting and finishing | Mixed | Interior holiday projects, turnover, repair completion and selective refresh work | Bundle smaller scopes and build partnerships with restoration and remodeling firms | Discretionary postponement and margin pressure |
| Landscaping and exterior maintenance | Seasonally mixed | Fall cleanup, irrigation shutdown, tree work, drainage and snow-service preparation | Convert seasonal visits into recurring property plans and route density | Weather variability and underpriced snow or storm commitments |
| Cleaning and appliance repair | Stable to strong around holidays | Holiday preparation, guest activity, appliance failure and homeowners choosing repair before replacement | Protect booking speed and build repeat-service reminders | Schedule compression and low-margin emergency routing |
Jobs forecast: home services should keep hiring, but the labor market will not feel easy
There is no official federal forecast for home service employment specifically in Q4 2026, so the quarter-level view requires inference from current construction labor data and the longer-run occupational outlook.
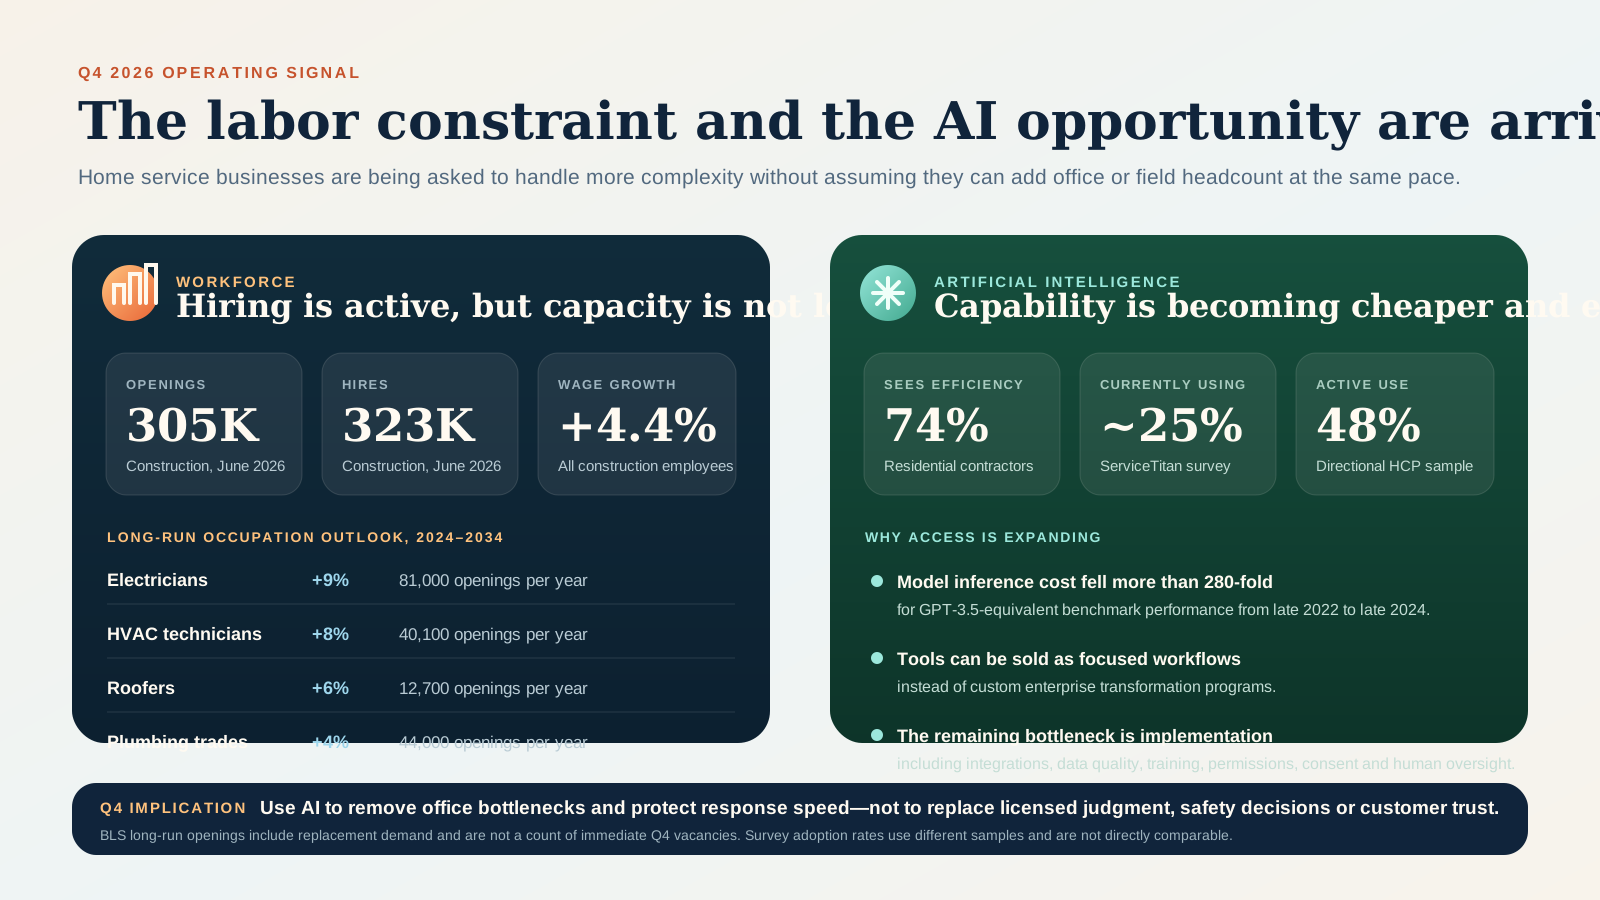
The near-term data point to continued demand for workers without an abundance of available capacity. Construction payrolls rose by 22,000 in July, even as total nonfarm employment changed little. In June, construction employers reported 305,000 job openings, up from 224,000 a year earlier. Hires were 323,000, below the 350,000 recorded in June 2025, while total separations were 319,000.
Pay is also moving. Average hourly earnings for all construction employees reached $41.46 in July, about 4.4% above the year-ago level. For construction production and nonsupervisory workers, average hourly earnings were $39.24, roughly 5.2% higher than a year earlier.
TradeVulcan Dispatch’s base-case inference is that Q4 hiring remains positive but selective. Contractors are more likely to prioritize experienced revenue-producing technicians, apprentices with a credible development path, strong CSRs and dispatchers, and multi-skilled office operators than to build speculative headcount. Retention, productivity and schedule quality will matter as much as recruiting volume.
Long-run skilled-trade employment outlook
| Occupation | Employment growth, 2024–2034 | Average annual openings | Long-run demand signal |
|---|---|---|---|
| Electricians | 9% | 81,000 | Power, controls, building systems, electrification and replacement demand support above-average growth |
| HVAC and refrigeration mechanics/installers | 8% | 40,100 | Repair, replacement, complex climate systems, energy efficiency and retrofit work support strong demand |
| Roofers | 6% | 12,700 | Roof repair and replacement, new construction and some rooftop solar work support demand |
| Plumbers, pipefitters and steamfitters | 4% | 44,000 | Existing-building maintenance, repair, construction and code requirements sustain replacement and growth demand |
Q4 workforce priorities
- Build staffing from booked-demand and capacity data rather than annual revenue targets alone.
- Measure technician utilization without rewarding rushed diagnostics, unsafe work or unnecessary replacement.
- Protect dispatcher and CSR capacity during weather events, holidays and after-hours surges.
- Create apprenticeship and helper pathways before the experienced-technician opening becomes urgent.
- Track compensation, overtime, callbacks, drive time, schedule gaps and manager span together—not as separate problems.
- Automate repetitive office work before assuming every bottleneck requires another full-time hire.
- Keep human escalation for safety, licensing, customer distress, unusual scopes and high-value decisions.
AI adoption is accelerating, but the industry is still early
Contractor AI adoption is advancing quickly, but different surveys produce different adoption rates because they measure different samples and levels of use.
ServiceTitan’s 2026 residential report surveyed 1,000 contractors. Seventy-four percent viewed AI as an efficiency engine, yet only about 25% said they were currently using it. Among early adopters, 48% reported increased productivity and 45% reported time savings.
A separate ServiceTitan study of more than 1,000 residential and commercial trade participants found only 12% had embedded AI into operations, while 34% were actively experimenting. The top barriers were training and skilled staff, cited by 44%; integration complexity, also 44%; difficulty understanding the tools, 38%; and unclear ROI, 37%.
Housecall Pro’s smaller 2026 directional survey of 248 home service professionals found 48% actively using AI. The most common applications were customer communication and follow-up, estimates and quoting, and business planning and reporting. Forty percent of AI users said it helped them respond faster and lose fewer leads; 31% said they saw ROI almost immediately, with another roughly one in five reporting a clear return within a few months.
The surveys do not establish one definitive national adoption rate. Together, they show an industry moving from curiosity into implementation, with the largest gap no longer basic model capability but workflow design, integration, training and proof of value.
Why advanced automation is reaching smaller contractors now
The economics of AI delivery have changed sharply.
Stanford’s 2025 AI Index reported that the cost of querying a model with GPT-3.5-equivalent benchmark performance fell from $20 per million tokens in November 2022 to $0.07 by October 2024—a decline of more than 280-fold. The smallest model reaching a specified MMLU performance threshold also shrank from 540 billion parameters in 2022 to 3.8 billion in 2024.
That does not mean a complete contractor automation program became 280 times cheaper. Model inference is only one cost layer. Real deployment still requires software development, integrations, data mapping, permissions, messaging compliance, monitoring, training, support and human escalation.
What changed is the entry point. Capable language, classification, summarization, extraction and conversational functions can now be packaged inside focused software workflows rather than built as an enterprise research project. Reusable APIs and connectors allow software companies to spread development cost across many customers. For contractors, advanced automation is increasingly available as a modular operating expense instead of a custom transformation program.
Where AI is most likely to produce measurable Q4 value
| Workflow | Useful AI role | Metric to prove value | Human control that remains |
|---|---|---|---|
| Missed and unanswered calls | Identify the event, initiate approved outreach, summarize context and route the opportunity | Response time, contact rate, appointments and recovered revenue | Consent, escalation, emergency handling and final booking rules |
| Website chat, forms and booking | Answer approved questions, gather structured details and guide the visitor toward a supported booking path | Visitor-to-conversation rate, qualified leads, bookings and abandonment | Pricing commitments, safety advice, service-area exceptions and unusual requests |
| Open estimate follow-up | Prioritize estimates, draft contextual follow-up and maintain an approved cadence | Contact rate, days to decision, close rate and recovered gross profit | Discount authority, financing disclosures, scope changes and customer objections requiring judgment |
| Phone answering and intake | Handle routine questions, collect details, summarize and route based on rules | Answer rate, containment, booking rate, transfer quality and customer satisfaction | Distress, emergencies, disputes, sensitive data and complex technical diagnosis |
| Reviews and proof | Trigger requests, organize job context and help turn completed work into approved local proof | Review velocity, response rate, content coverage and assisted conversion | Authenticity, customer permission, claim accuracy and final publication approval |
| Lead and customer data | Deduplicate, enrich, classify, summarize and surface the next action | Record completeness, duplicate reduction, speed to assignment and worked-lead rate | Source-of-truth selection, sensitive data, ownership and destructive changes |
| Management reporting | Summarize performance, explain exceptions and prepare coaching or planning views | Hours saved, decision cycle, forecast accuracy and action completion | Metric definition, financial judgment, employment decisions and accountability |
TradeVulcan perspective: the functional technology gap has narrowed
TradeVulcan is commercially interested in this trend because it develops AI-enabled applications for contractors. The following is the company’s operating thesis, not an independent market-size finding.
For years, sophisticated contractor automation was concentrated among larger organizations that could support enterprise software, specialized implementation, multiple vendors, internal administrators and custom integration work. A company producing $10 million or more in annual revenue had more ability to assemble call analytics, automated follow-up, online booking, customer-data workflows, reputation systems, AI answering and executive reporting. A contractor producing $300,000 to $2 million often had the same operational problems but not the budget, staff or implementation capacity to build that stack.
AI and modern software delivery have changed the functional access point. A contractor in the $300,000-to-$2 million range can now obtain the same categories of capability—though not necessarily the same enterprise depth, staffing or customization—as a much larger operator. The practical barrier has fallen because models are cheaper, software components are reusable, integrations can be productized and a focused application can solve one revenue leak without replacing the entire CRM.
TradeVulcan’s approach is to let contractors keep supported systems they already use and add targeted tools: CallSpark for missed-call and unbooked-call recovery; Site Spark for website chat, structured lead capture and booking; Close Forge for estimate follow-up; Vulcan Voice for call answering and routing; Proof Pulse for reviews and local proof; Leads Forge for cleaner opportunity data; Vulcan Score for management visibility; and Map Forge for local-search intelligence.
The promise is not that a small contractor instantly operates like a $50 million platform. Larger businesses still have advantages in process maturity, management capacity, data volume and implementation resources. The change is that advanced workflow categories are no longer reserved for them. A smaller company can start with one measurable problem, prove the return and add the next layer when the operation is ready.
In Q4, that democratization matters because labor is expensive and difficult to add. The most valuable automation is the automation that protects the human team: answering sooner, keeping estimates from disappearing, booking more of the demand already paid for and giving owners visibility without requiring another layer of office overhead.
AI does not remove the need for an operating system
AI cannot fix a broken process merely by speaking more naturally.
Contractors still need defined ownership, approved offers, service-area rules, capacity, accurate pricebooks, consent-aware communication, clean CRM records, escalation paths, quality assurance and leadership accountability. AI can make a good workflow faster and more consistent. It can also make a poorly governed workflow fail at greater speed.
The Q4 standard should be measurable automation with clear human control—not maximum automation for its own sake.
Three Q4 scenarios contractors should plan around
Base, upside and downside cases
| Scenario | What it looks like | Likely winners | Preparation now |
|---|---|---|---|
| Base case | Essential repair remains steady, remodeling growth slows, homeowners compare more options, skilled labor remains tight and AI pilots expand | Companies with fast response, financing, disciplined follow-up, memberships and good capacity management | Audit conversion leaks, protect labor, segment seasonal campaigns and require ROI metrics for automation |
| Upside case | Early cold, major regional weather events, mortgage-rate relief or stronger housing turnover lifts service and project demand | Operators with surge staffing, parts access, strong intake, referral networks and geographic discipline | Pre-negotiate capacity, lodging, suppliers, financing and escalation before the event |
| Downside case | Mild weather, consumer caution, higher financing friction or material and insurance pressure delays elective work | Lean operators with recurring revenue, repair options, strong retention and low lead waste | Stress-test cash, reduce speculative inventory, improve estimate recovery and avoid buying low-quality lead volume |
The indicators to watch during Q4
| Indicator | Why it matters | Next useful signal |
|---|---|---|
| NAHB Remodeling Market Index | Tracks remodeler current conditions, leads and backlog sentiment | Third-quarter release scheduled for October 8, 2026 |
| Harvard LIRA | Updates the national trajectory for owner-occupied improvement and repair spending | Next release scheduled for October 22, 2026 |
| BLS employment and JOLTS | Shows construction payrolls, openings, hires, separations, hours and wages | Monthly releases throughout Q4 |
| Freddie Mac mortgage rates and NAR sales | Housing turnover affects move-related work, project confidence and stay-put behavior | Weekly rates and monthly sales data |
| Local weather and energy demand | Heating, storm, freeze, wildfire and outage events can overwhelm broad economic signals | NWS, CPC, EIA and utility updates |
| Company conversion data | National forecasts cannot reveal a contractor’s missed calls, unworked estimates or capacity loss | Weekly speed-to-lead, booking, close, cancellation, callback and gross-profit reviews |
A 90-day Q4 operating plan
- Separate essential repair, replacement, maintenance and discretionary-remodel demand in the forecast; they will not behave the same way.
- Set local weather and call-volume thresholds for adding after-hours coverage or moving technicians between maintenance and service.
- Audit every lead path—phone, web, text, form, referral and estimate—and measure how long it takes to reach a human or approved automated next step.
- Build a financing and payment-options playbook that is clear, compliant and available before the customer rejects the scope.
- Create a formal open-estimate queue with ownership, cadence, reason codes and escalation instead of relying on individual memory.
- Review technician, CSR and dispatcher retention risk before peak winter demand; calculate the cost of turnover against compensation and training investment.
- Choose one or two AI workflows with a measurable baseline rather than launching a broad collection of disconnected tools.
- Require human review for safety, diagnosis, discounting, sensitive customer situations, unusual scopes and material financial commitments.
- Segment maintenance and reactivation outreach by equipment, property, service history, climate and customer need—not a generic holiday blast.
- Prepare downside cash and staffing scenarios even while preserving surge capacity for cold snaps and weather events.
- Review the October RMI and LIRA releases and update the forecast rather than treating an August article as a fixed plan.
- Report Q4 performance as booked work, gross profit, response speed, close rate, retention and capacity—not lead volume alone.
Q4 2026 home services trends and forecast FAQ
What is the Q4 2026 outlook for the U.S. home services market?
The base case is resilient essential repair and maintenance demand, slower discretionary remodeling growth, continued price sensitivity, tight skilled labor and faster adoption of AI-enabled workflows. Local weather and housing conditions can produce substantial regional differences.
How large is the U.S. home services market?
Marketdata estimates that nine broad U.S. home-maintenance service categories generated $543 billion in 2025 and forecasts 5.3% annual growth through 2030. The estimate is broader than federal or Harvard measures of residential improvement and repair spending, so the figures are not directly interchangeable.
Will home improvement and remodeling slow in Q4 2026?
Harvard JCHS projects year-over-year owner-occupied improvement and repair spending growth slowing to 1.6% by the end of 2026. NAHB remodeler sentiment remained positive at 61 in the second quarter, so the evidence points to deceleration and greater selectivity rather than a broad collapse.
Which home service trades have the strongest Q4 demand?
HVAC, plumbing, electrical and urgent roofing repair have the strongest essential-service floor. Heating weather, freezes, outages and storms can lift regional demand quickly. Pest, cleaning, landscaping, garage-door and appliance work have more specific seasonal patterns.
What is the jobs forecast for home service contractors?
There is no official home-services-only Q4 forecast. Current BLS data show active construction hiring, elevated openings and rising wages, while long-run projections show above-average growth for electricians, HVAC technicians and roofers. The likely Q4 condition is continued hiring demand with limited experienced labor.
Is AI adoption increasing in home services?
Yes. ServiceTitan and Housecall Pro surveys use different samples but both show rapid movement from interest into practical use. Common applications include customer communication, follow-up, estimating support, booking, intake, reporting and workflow prioritization.
Can a small contractor afford the same technology as a large home service company?
Small contractors can increasingly access the same categories of automation, including AI answering, booking, follow-up, data cleanup, reputation workflows and reporting. They do not automatically receive the same implementation depth, staffing or customization as a large enterprise. The functional entry barrier has narrowed, but process and execution still matter.
How does TradeVulcan fit the Q4 home services technology trend?
TradeVulcan offers modular AI-enabled applications that work alongside supported contractor systems. Its stated approach is to let a company start with one measurable problem—such as missed calls, website booking, estimate follow-up, answering, reviews, lead data or visibility—before adding more tools. TradeVulcan is the publisher’s parent company, and that commercial interest is disclosed in this article.
What should a home service owner do before Q4 begins?
Audit lead response and estimate follow-up, preserve skilled-labor capacity, prepare financing and seasonal campaigns, create weather surge thresholds, review retention risk and select only AI workflows with a measurable baseline and human escalation.
Methodology
TradeVulcan Dispatch reviewed the user-supplied Yahoo Finance report, the underlying Marketdata summary, Harvard JCHS remodeling forecasts, NAHB remodeling indicators, Census construction spending, NAR and Freddie Mac housing data, Housecall Pro homeowner and AI surveys, ServiceTitan contractor AI studies, BLS employment, JOLTS and occupation projections, Stanford AI Index cost and adoption data, and TradeVulcan’s current public product descriptions. Market and survey figures use different definitions and samples and are presented with those limitations. The Q4 demand and jobs sections are editorial inferences from current data, not official federal quarterly forecasts. The TradeVulcan section is labeled company perspective because the publisher has a direct commercial interest.
Sources
- U.S. Home Maintenance Services Market Report 2026 — Yahoo Finance / ResearchAndMarkets.com
- U.S. Home Services Market Worth $543 Billion — Marketdata Enterprises
- Remodeling Spending Poised for Further Slowdown — Harvard Joint Center for Housing Studies
- Remodeling Growth Set to Downshift in Late 2026 — Harvard Joint Center for Housing Studies
- Remodeling Market Sentiment Remains in Positive Territory in Second Quarter — National Association of Home Builders
- Three States Drive Over 20% of Remodeling Activity, NAHB Research Finds — National Association of Home Builders
- Monthly Construction Spending, June 2026 — U.S. Census Bureau
- NAR Existing-Home Sales Report Shows 2.4% Decrease in June — National Association of Realtors
- Primary Mortgage Market Survey, August 20, 2026 — Freddie Mac
- 2026 Home Services Report: How Homeowners Are Spending & Hiring — Housecall Pro
- Employment Situation, July 2026 — U.S. Bureau of Labor Statistics
- Job Openings and Labor Turnover, June 2026 — U.S. Bureau of Labor Statistics
- Heating, Air Conditioning, and Refrigeration Mechanics and Installers — U.S. Bureau of Labor Statistics
- Electricians — U.S. Bureau of Labor Statistics
- Plumbers, Pipefitters, and Steamfitters — U.S. Bureau of Labor Statistics
- Roofers — U.S. Bureau of Labor Statistics
- ServiceTitan Report Finds 74% of Residential Contractors See AI as Key to Efficiency — ServiceTitan
- 2026 State of AI in the Trades — ServiceTitan
- AI in Field Service Management: How Early Adopters Win — Housecall Pro
- AI Index 2025: State of AI in 10 Charts — Stanford Institute for Human-Centered Artificial Intelligence
- Economy — 2026 AI Index Report — Stanford Institute for Human-Centered Artificial Intelligence
- TradeVulcan product and workflow overview — TradeVulcan