
How to use these targets
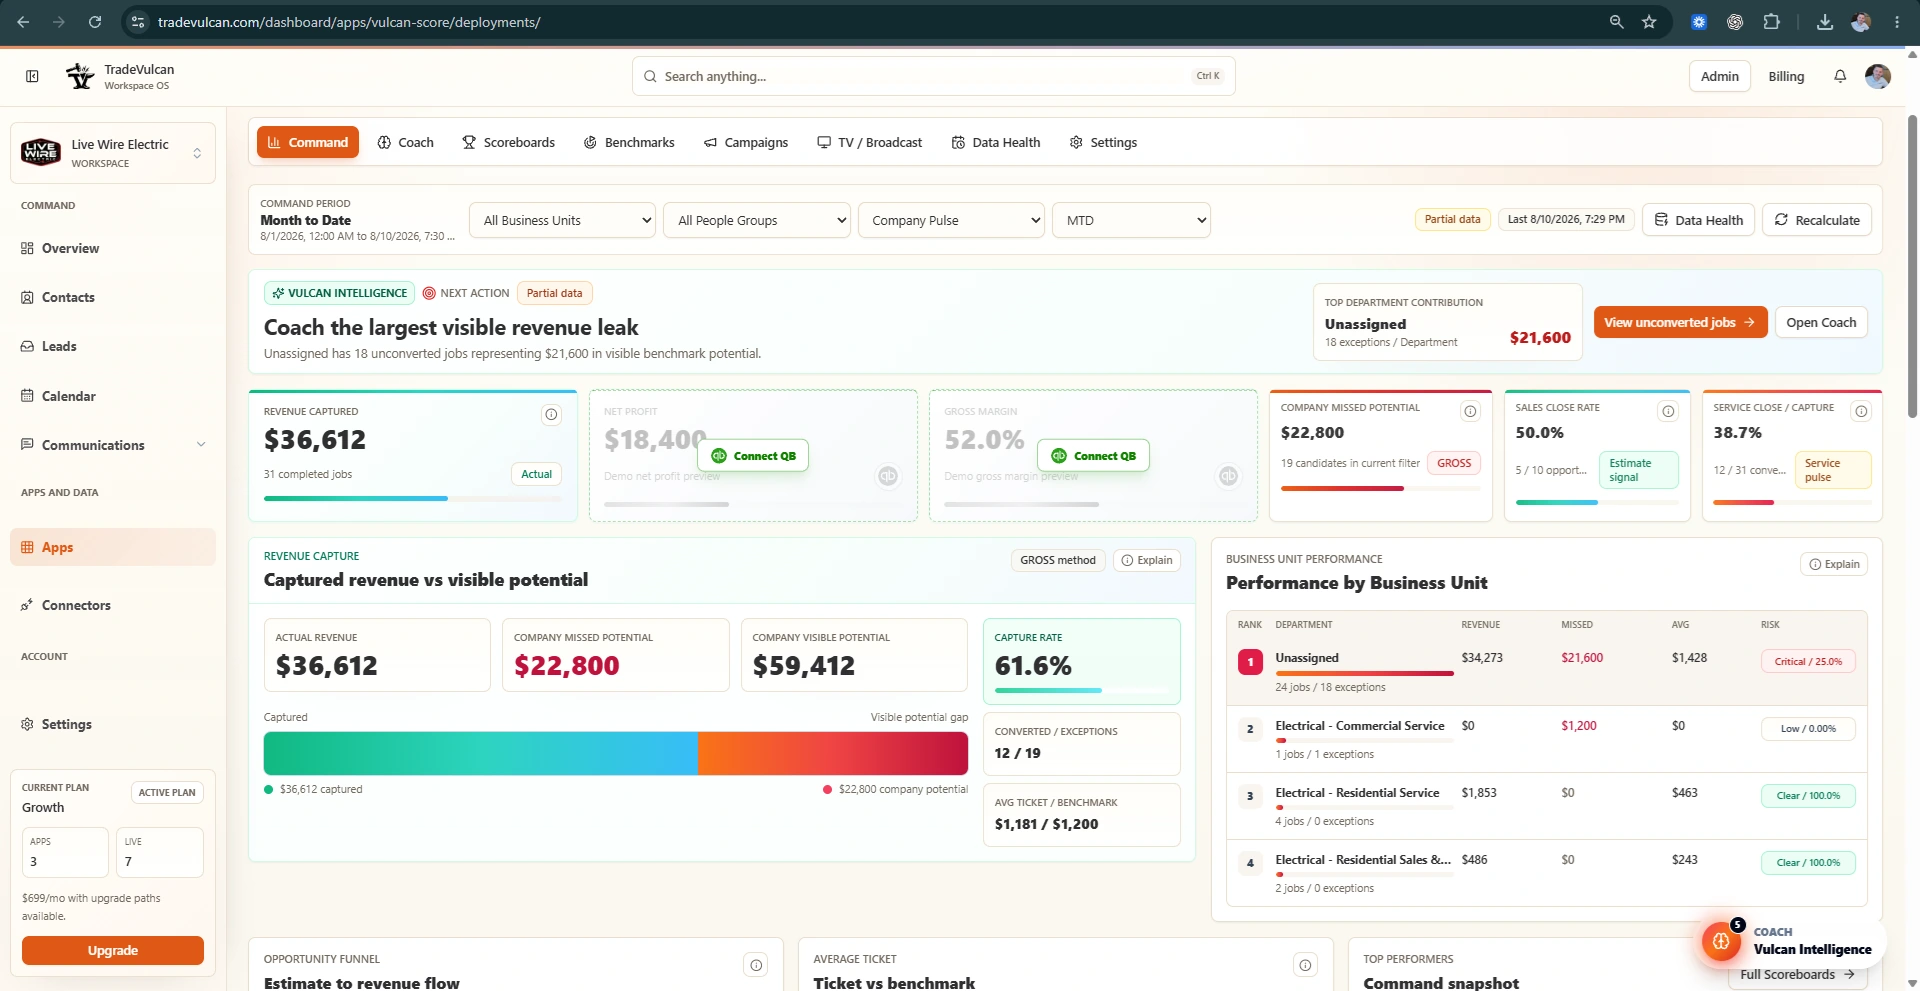
Home service benchmark targets are useful only when they are tied to your operating model. A residential HVAC service department, a plumbing drain department, a roofing sales team, and an install crew can all be healthy while carrying very different average tickets, close rates, margins, and capacity targets.
Use these ranges as practical starting points, not universal truth. The right number depends on market, pricebook, membership mix, dispatch mix, financing, lead source, labor capacity, seasonality, CRM setup, accounting setup, and whether the KPI is being used for coaching, goals, contests, or rewards.
What makes a benchmark useful?
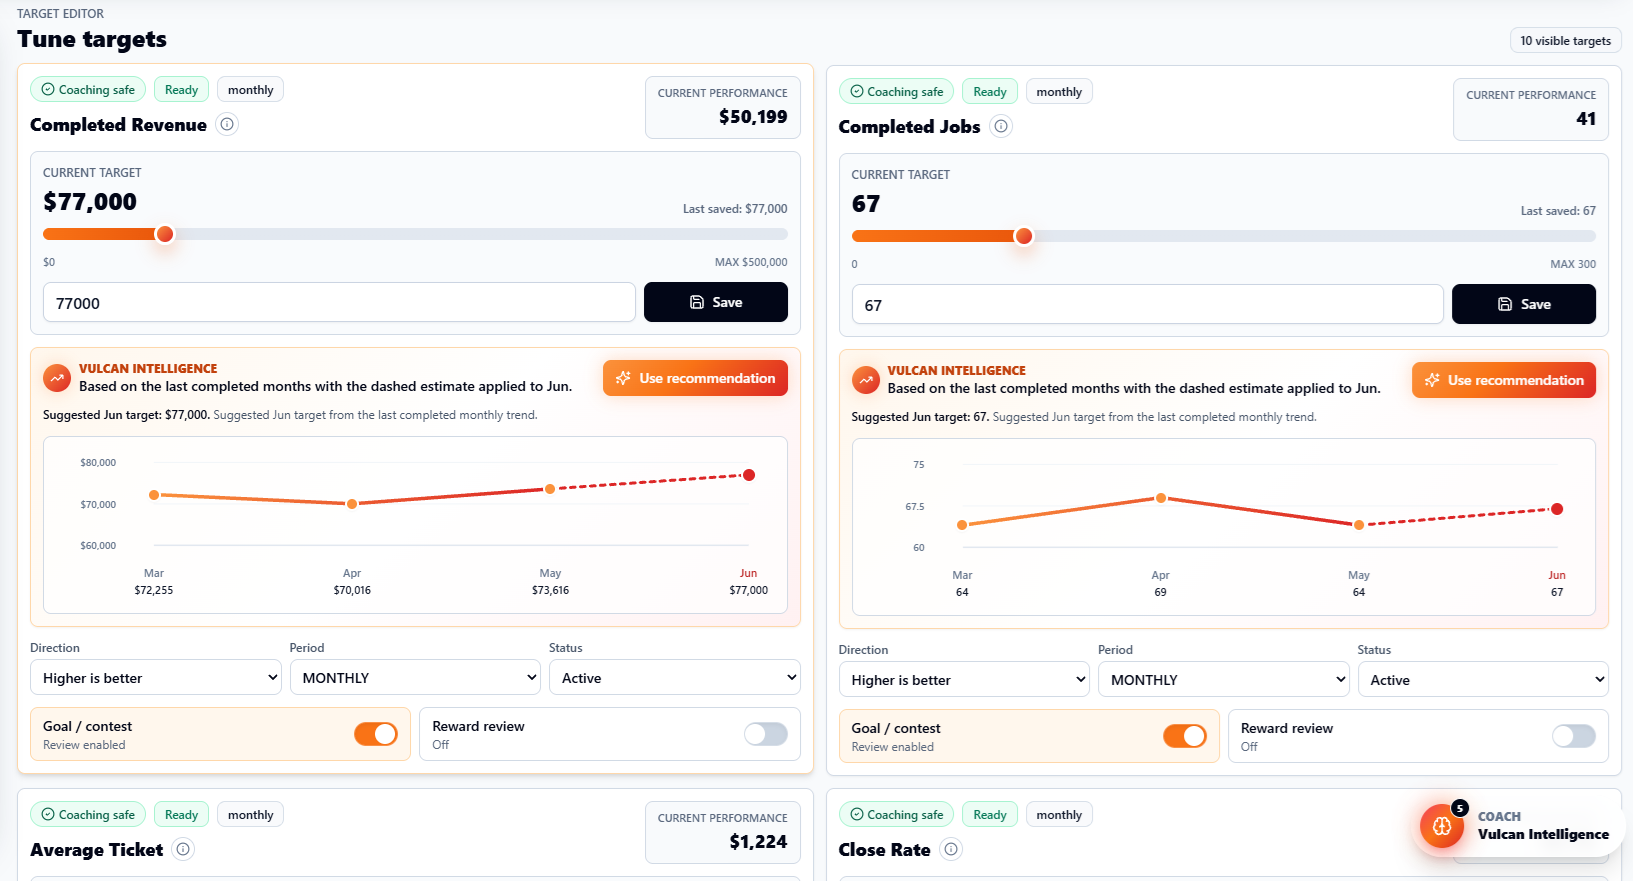
A good benchmark should be specific enough to guide behavior and realistic enough for the team to believe. The best targets usually combine four inputs: built-in industry guidance, recent company performance, current capacity, and the manager's growth plan.
| Benchmark input | Why it matters | Common mistake |
|---|---|---|
| Industry guidance | Gives the company a practical outside reference point. | Copying a target from another company without matching trade, market, or job mix. |
| Recent performance | Shows what the team has already proven it can do. | Setting a target below recent performance, which makes goals and contests too easy. |
| Capacity | Connects the goal to trucks, techs, CSRs, salespeople, and install crews. | Creating a revenue goal the team cannot physically produce with current staffing. |
| Source confidence | Protects the business from coaching or rewarding bad data. | Using a KPI for rewards when attribution, revenue, call, or accounting facts are incomplete. |
Core owner-level KPIs
| KPI | Practical target | How to use it |
|---|---|---|
| Completed revenue | Budget, capacity, or recent monthly trend | Use revenue pacing to drive daily dispatch, sales follow-up, and capacity planning. |
| Completed jobs | Capacity-based | Set from dispatch availability, technician count, install crews, and historical completed-job volume. |
| Average service ticket | $500 to $1,200 for many residential service teams | Use to coach options, repairs, memberships, and minimum-ticket expectations. |
| Service close or capture rate | 60% to 85% | Use to coach estimate presentation, job qualification, and unconverted or low-revenue calls. |
| Sales close rate | 30% to 55% | Use only when presented estimates, sold/open status, and salesperson attribution are reliable. |
| Gross margin | 45% to 60% service, 35% to 50% install | Use QuickBooks, job costing, or accounting data before tying this to rewards. |
| Net profit | 10% to 20% is a healthy long-term target for many operators | Use with accounting context because owner pay, overhead, rent, vehicles, marketing, and debt treatment vary. |
HVAC Service KPI targets
HVAC service targets depend heavily on whether the department includes maintenance tune-ups, demand service, accessory opportunities, and replacement lead setting. Separate maintenance from demand service when possible.
| KPI | Starting range | Manager note |
|---|---|---|
| Average service ticket | $350 to $900 | Maintenance-heavy teams may be lower; demand repair teams should generally trend higher. |
| Service capture / close | 60% to 85% | Options, memberships, replacement lead setting, and technician presentation drive this. |
| Zero revenue rate | Under 5% to 10% | Review warranty, callback, no-charge, and dispatch-fee rules before coaching. |
| Membership conversion | 20% to 40% | Only use when membership facts are trusted and the customer mix supports the offer. |
| Callback rate | Under 3% to 5% | Good for quality coaching when callback tags or recall fields are reliable. |
HVAC Install and replacement targets
Replacement and install KPIs should not be mixed with service-ticket benchmarks. They use different sales cycles, labor constraints, material costs, and gross margin expectations.
| KPI | Starting range | Manager note |
|---|---|---|
| Average sale | $8,000 to $18,000 | System type, equipment mix, financing, add-ons, and market pricing matter. |
| Sales close rate | 35% to 55% | Requires estimate status, sold/open values, and salesperson attribution. |
| Install gross margin | 35% to 50% | Requires trusted labor, material, equipment, subcontractor, and rebate treatment. |
| Install callback / warranty | Under 3% | Only use when callback facts are trusted and warranty work is labeled. |
Plumbing service targets
Plumbing average ticket can vary widely because water heaters, fixture work, drain calls, repipes, and sewer opportunities all behave differently. If sewer or excavation is a major line of business, separate it from everyday plumbing service.
| KPI | Starting range | Manager note |
|---|---|---|
| Average ticket | $500 to $1,200 | Water heater, sewer, and fixture mix can move this substantially. |
| Service capture / close | 65% to 90% | Use options, financing, and clear minimum-ticket expectations. |
| Zero revenue rate | Under 5% to 10% | Review dispatch fee, warranty, non-bookable calls, and estimate-only visits. |
| Gross margin | 45% to 60% | Material purchasing and labor burden can change the true margin quickly. |
Drain and sewer targets
Drain and sewer teams need their own targets because camera work, jetting, excavation, lining, and replacement opportunities can create very different ticket sizes than standard plumbing service.
| KPI | Starting range | Manager note |
|---|---|---|
| Average ticket | $500 to $1,500 | Camera, jetting, excavation, and sewer replacement mix matter. |
| Service capture / close | 60% to 85% | Separate drain clearing from sewer replacement opportunities. |
| Replacement leads set | 15% to 30% of qualifying drain/sewer calls | Use only when replacement lead facts are available. |
| Zero revenue rate | Under 5% to 10% | Watch for free camera visits, waived diagnostics, or non-bookable calls. |
Electrical service targets
Electrical service teams can create strong ticket growth through safety inspections, panel opportunities, surge protection, generators, EV chargers, and clear options presentation.
| KPI | Starting range | Manager note |
|---|---|---|
| Average ticket | $400 to $1,200 | Panel work, generators, lighting, and safety repairs can lift ticket size. |
| Service capture / close | 65% to 90% | Use options presentation and safety inspection process. |
| Zero revenue rate | Under 5% to 10% | Review estimate-only, diagnostic-only, warranty, and no-charge visits. |
| Gross margin | 45% to 60% | Material costs and apprentice/journeyman labor mix matter. |
Roofing targets
Roofing companies should separate repair, replacement, inspection, insurance, retail sales, and production. A repair average ticket and a replacement average sale are different KPIs and should not share one target.
| KPI | Starting range | Manager note |
|---|---|---|
| Repair average ticket | $500 to $2,500 | Separate repair from replacement and insurance claims. |
| Replacement average sale | $8,000 to $25,000 | Roof size, material, insurance, financing, and retail pricing change the number. |
| Sales close rate | 25% to 45% | Lead quality, inspection process, follow-up speed, and financing matter. |
| Gross margin | 35% to 50% | Material and subcontractor cost confidence is essential. |
| Production cycle time | Market-specific | Use once production milestones are tracked reliably. |
CSR and Dispatch targets
CSR benchmarks should be based on call facts, not job revenue. If calls are not available, the right setup state is to connect or map call data, not fake CSR performance from field work.
| KPI | Starting range | Manager note |
|---|---|---|
| Booking rate | 65% to 85% | Depends on lead source, call type, service area, pricing, and routing. |
| Abandoned / missed calls | Under 5% to 10% | Review phone routing, staffing, and abandoned bucket cleanup. |
| Average inbound duration | Long enough to qualify, short enough to stay efficient | Very short calls may be non-bookable, spam, repeat customers, or routing issues. |
| Agent attribution | High coverage | Individual CSR coaching is low-confidence when most calls are unassigned. |
| Source booking rate | Source-specific | Compare Google Business Profile, paid ads, referrals, repeat customers, and campaign sources separately. |
When a benchmark is probably too low
- The current team is already beating the target without focused effort.
- The target is below the built-in Vulcan target for the department profile.
- The target is below recent actual performance for enough sample size.
- The target is being used for contests or rewards and would pay for normal performance.
- The target was copied from a different department, such as using service ticket targets for install sales.
When a benchmark is probably too aggressive
- The target is more than double current performance without a staffing, pricebook, or lead-flow change.
- The company does not have enough completed jobs or calls to make the recent performance sample reliable.
- The metric requires source data that is missing, such as estimate status for sales close rate or Classes for department profit.
- The target ignores seasonality, dispatch mix, or whether the period is Month to Date versus a full month.
How Vulcan Score turns benchmarks into action
Vulcan Score uses KPI Profile Studio to connect targets to department views, current performance, recent trends, source confidence, and Vulcan Intelligence recommendations. That means a benchmark is not just a static number. It becomes a coaching threshold, a goal target, a contest review signal, and a reward safety check.
If Vulcan Intelligence says a target looks too easy, use the recommendation as a review prompt. If it says the KPI is not reward-safe, clean the data source or keep the KPI in coaching mode. If it says the CRM setup is comingled, improve Business Unit and Job Type mapping before treating department benchmarks as precise.
Contest and reward caution
A target can be good for coaching before it is safe for contests or rewards. Use Data Health and KPI Profile Studio safety labels before tying a metric to public recognition or reward economics.