
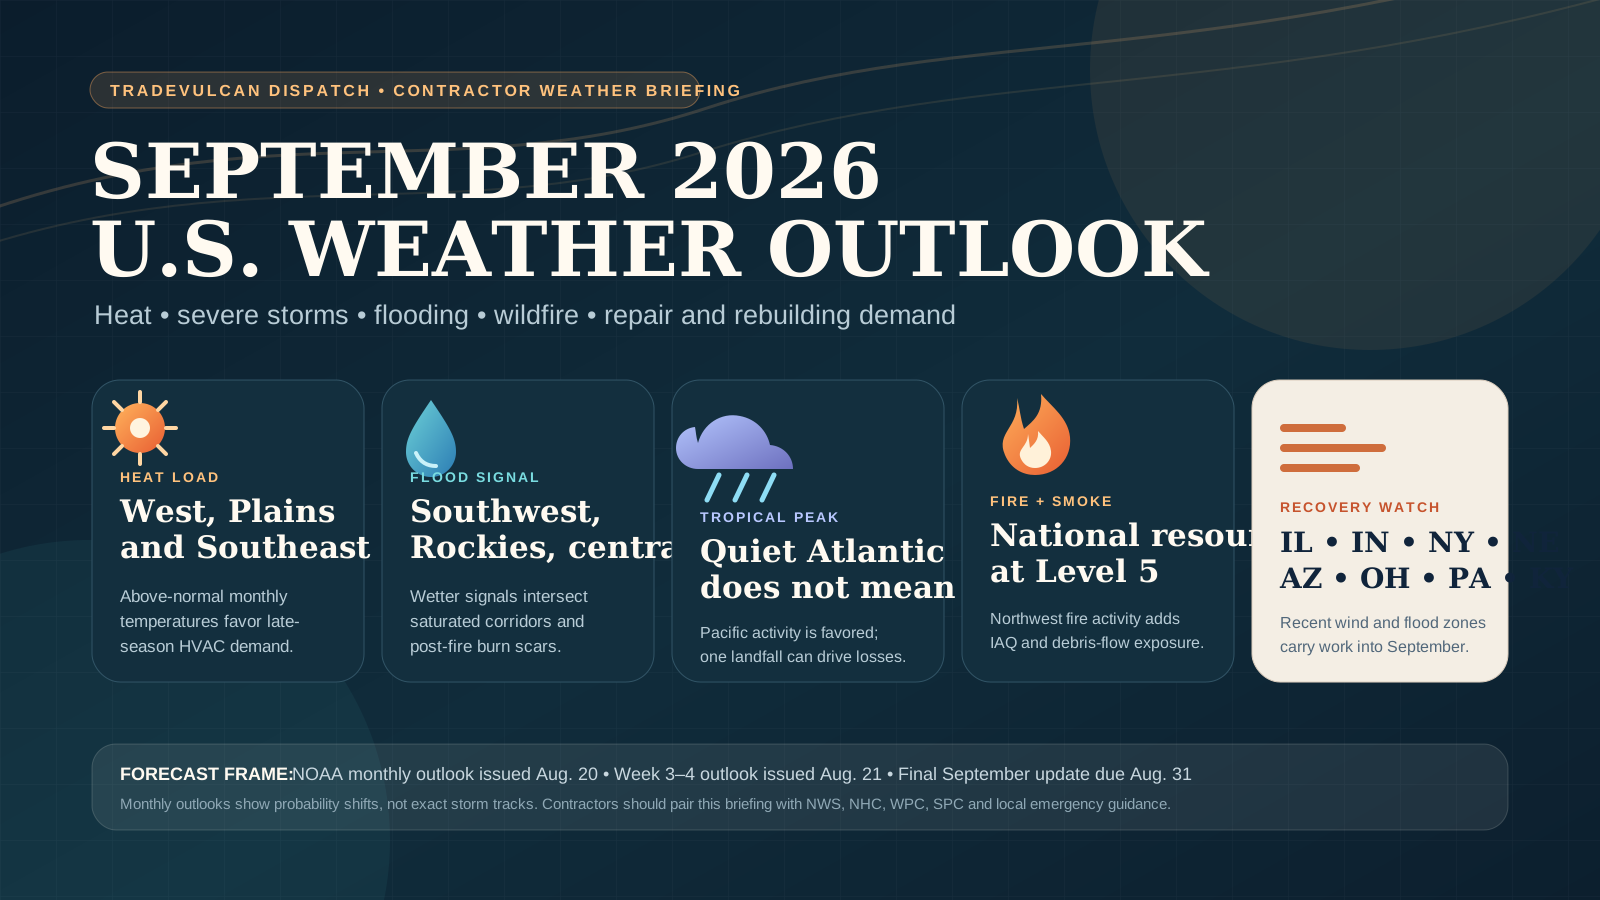
Forecast status: preliminary September outlook
NOAA’s Climate Prediction Center issued its preliminary September 2026 monthly outlook on August 20. The agency will issue the final monthly update on August 31, after this report’s publication.
This article is designed as an operating brief, not a storm-track prediction. TradeVulcan Dispatch will treat any August 31 changes as a material forecast update.
The national operating picture
September is setting up as a split-market month for home service contractors.
The clearest late-season heat signal covers the western United States, southern Plains and Southeast, with the strongest odds of above-normal monthly temperatures centered on the north-central Rockies and Intermountain West. For HVAC companies, that supports continued cooling-load pressure after Labor Day rather than an immediate shoulder-season slowdown.
The precipitation outlook is more complicated. NOAA favors wetter-than-normal conditions broadly across the West, including the Southwest and southern Rockies, while also showing a slight wetter tilt in the Ohio Valley, Central Plains and central Mississippi Valley. The Pacific Northwest and western Great Lakes lean drier. That combination creates simultaneous heat, wildfire-smoke, flash-flood, water-intrusion and post-fire debris-flow exposure in different markets.
The Atlantic basin is expected to finish below normal overall, but September remains inside the August-September-October peak of the season. The eastern and central Pacific are the more active tropical basins in 2026. Seasonal activity forecasts do not identify landfall locations, and one storm can still create a major roofing, electrical, water-restoration and rebuilding event.
Key takeaways for HVAC, roofing and restoration contractors
- Late-season HVAC demand is most likely to remain elevated across the West, southern Plains and Southeast, especially where dry ground amplifies daytime heat.
- The north-central Rockies and Intermountain West carry the strongest monthly warm signal.
- The Southwest, Northern Rockies and parts of the West Coast are favored wetter during the September 5-18 window, keeping monsoon flash-flood and water-intrusion risk in play.
- The Ohio Valley, Central Plains and central Mississippi Valley have a slight monthly wetter tilt after a summer that already produced saturated corridors and historic flooding.
- The Atlantic season is forecast below normal, but September is still a peak month and the outlook does not predict U.S. landfalls.
- The eastern Pacific is favored above normal, increasing the need to monitor Hawaii, Mexico/Baja and moisture-remnant pathways into the Southwest.
- National wildfire resources remain at Preparedness Level 5, and smoke, indoor-air-quality work and burn-scar flood exposure can persist into September.
- Recent documented repair zones include northern Illinois and northwest Indiana, central Illinois, central and east-central Indiana, eastern New York and western New England, the Phoenix West Valley, northern Ohio, northwest Pennsylvania and parts of Kentucky.
September contractor risk dashboard
- Cooling demand
- +4%
- Atlantic basin
- 75%
- Eastern Pacific
- 70%
- Wildfire operations
- PL 5
EIA expects 4% more U.S. cooling degree days in the third quarter of 2026 than in the third quarter of 2025.
NOAA probability of a below-normal 2026 Atlantic hurricane season; September still falls within the peak activity period.
NOAA probability of an above-normal eastern Pacific hurricane season.
National Preparedness Level 5, with 79 large fires being suppressed and 7.74 million acres burned year to date as of August 24.
September 2026 weather forecast at a glance
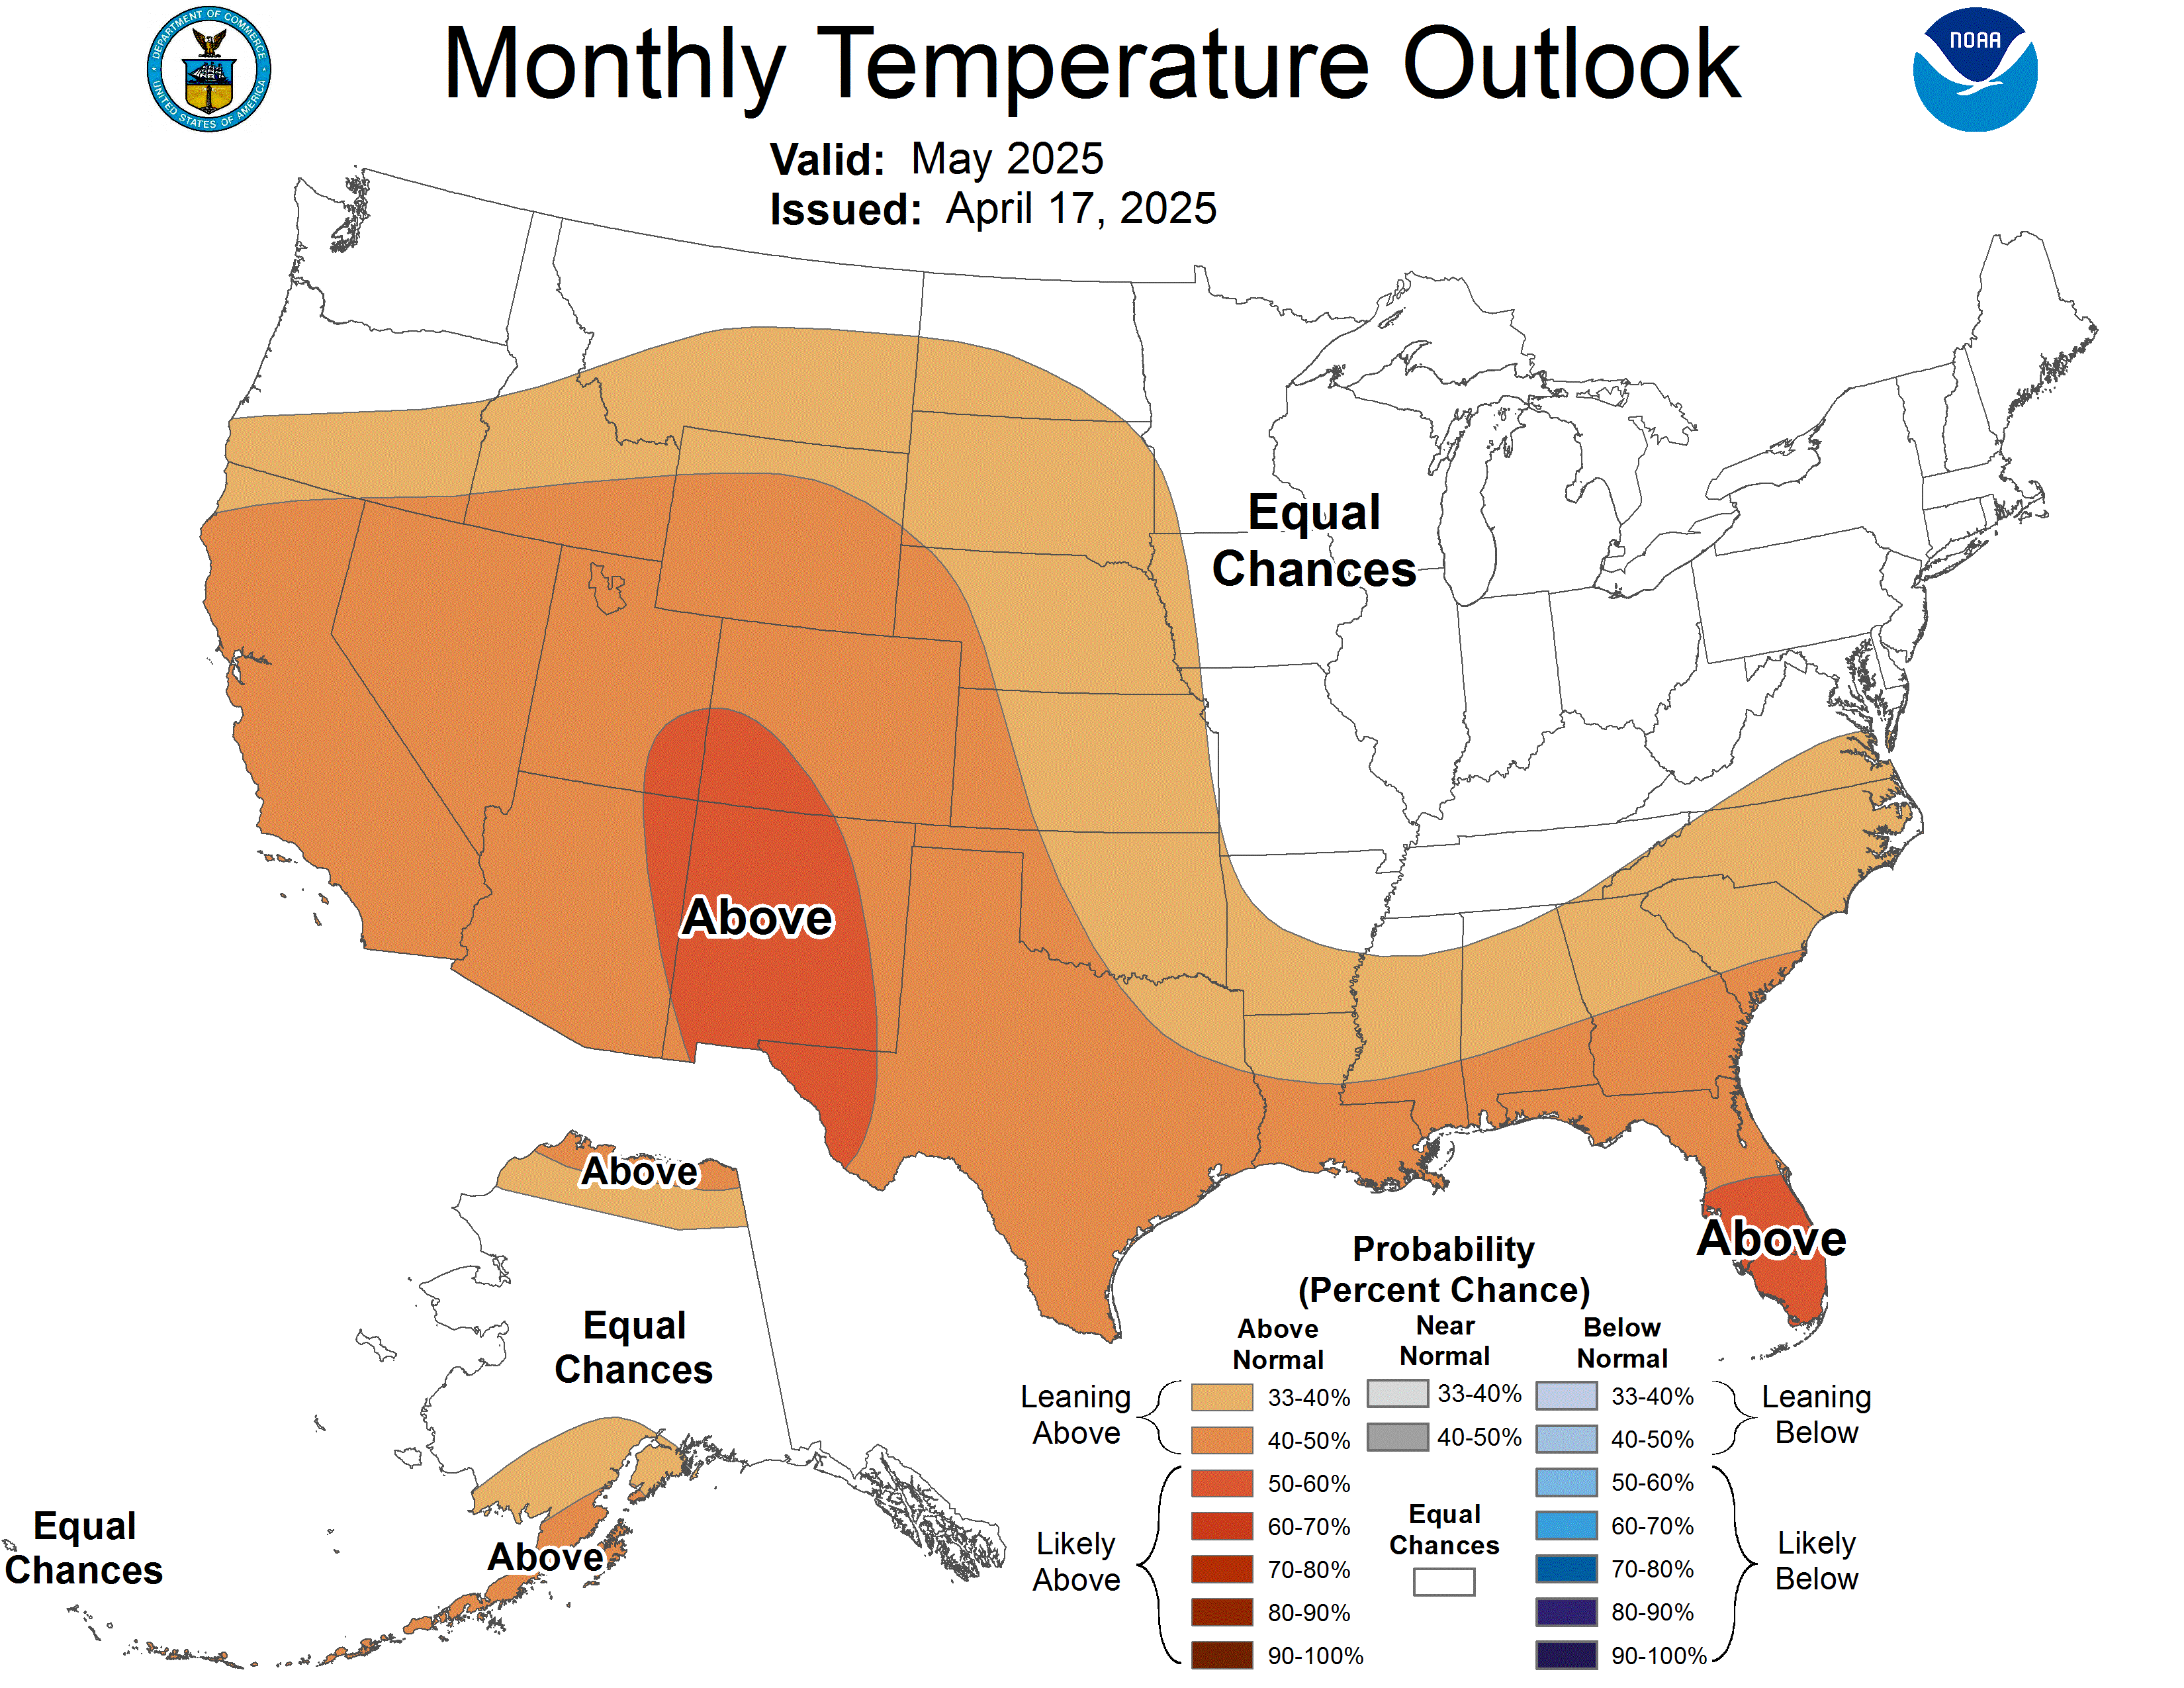
NOAA’s preliminary monthly outlook favors above-normal mean temperatures across the western contiguous United States, southern Plains, Southeast, Southeast Alaska and the Alaska Panhandle. Equal chances of above-, near- or below-normal temperatures cover the Northern Plains, Midwest, Northeast and parts of the Ohio Valley and Mid-Atlantic.
“Above normal” does not mean every day will be hot, and “equal chances” does not mean normal weather is guaranteed. The maps describe which monthly category is more likely relative to the 1991-2020 climate normal.
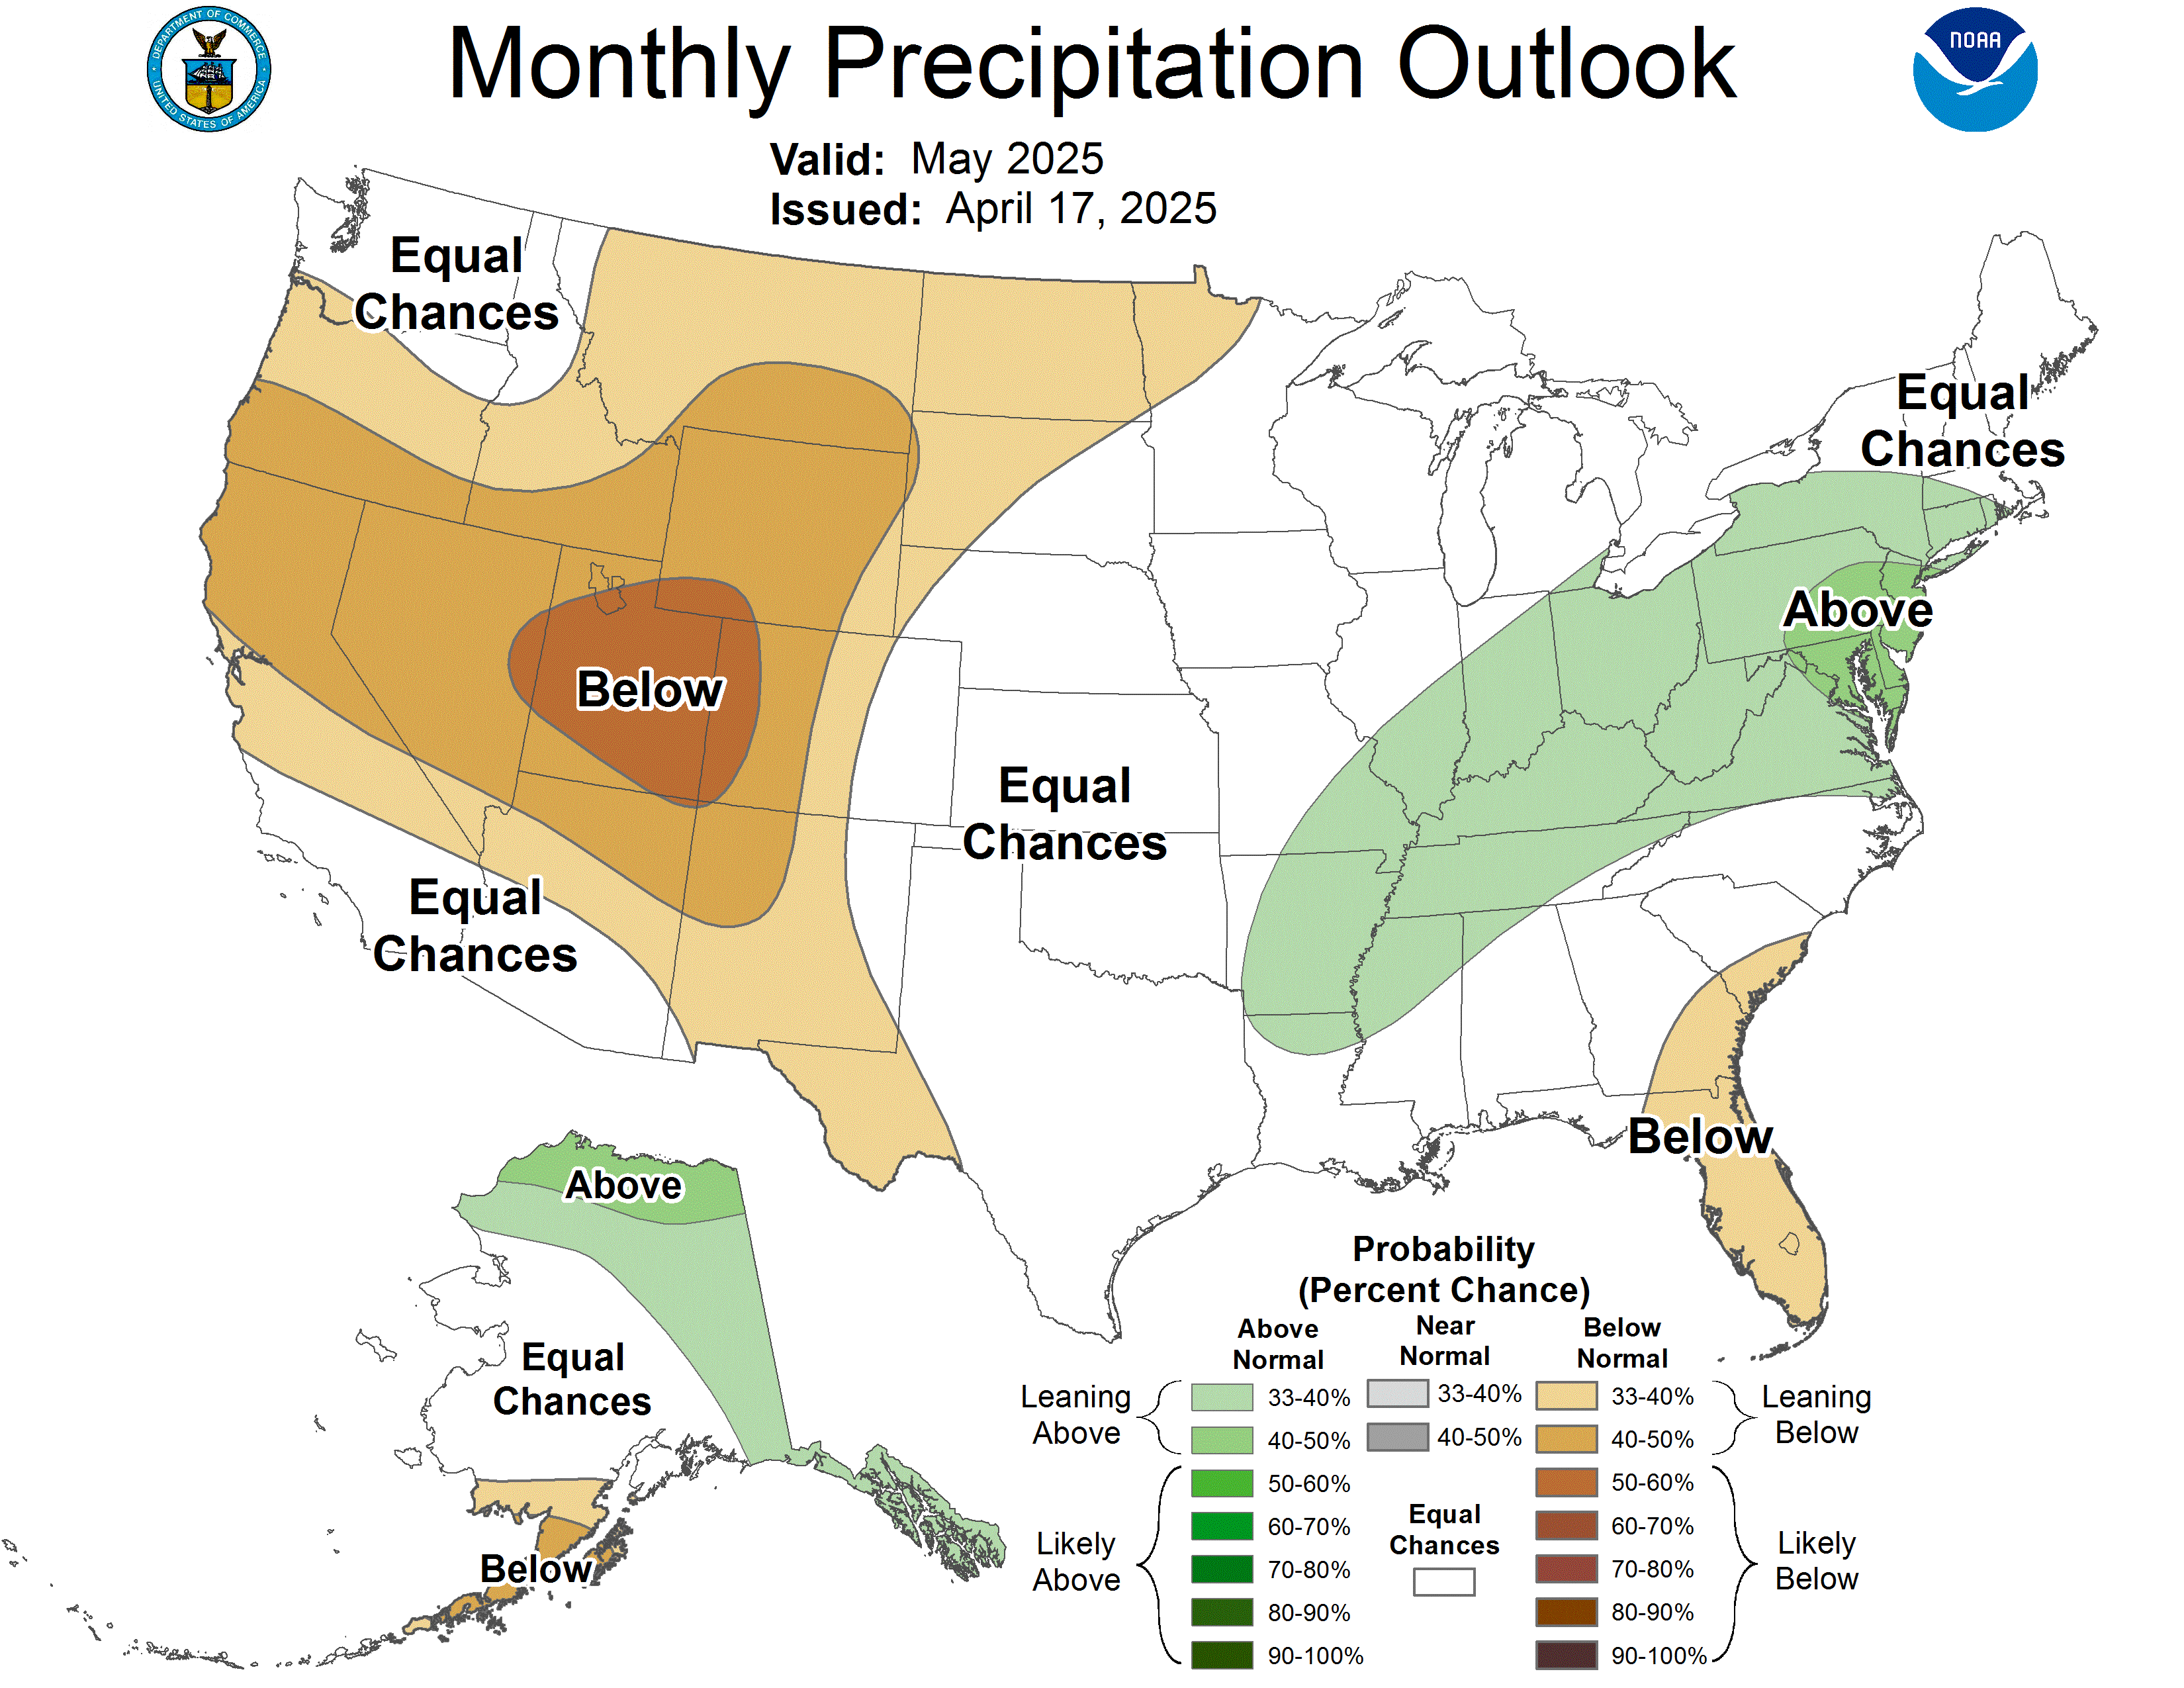
The monthly precipitation outlook favors wetter-than-normal conditions across much of the western United States. It also gives slightly increased odds of above-normal precipitation to the Ohio Valley, Central Plains and central Mississippi Valley. Below-normal precipitation is favored in the Pacific Northwest and western Great Lakes, although NOAA characterizes several precipitation signals as weak.
Regional forecast and likely contractor pressure points
| Region | September signal | Likely home-service pressure | Confidence / limitation |
|---|---|---|---|
| Intermountain West and north-central Rockies | Strongest odds of above-normal temperatures; wetter monthly tilt in many areas | Late cooling calls, electrical load issues, roof leaks, drainage, flash-flood response and burn-scar monitoring | High relative confidence on warmth; precipitation timing remains event-driven |
| Southwest and southern Rockies | Warm overall with wetter probabilities; September 5-18 also favors above-normal precipitation | HVAC stress, monsoon wind damage, water intrusion, mold, drainage and debris-flow response | Rain can locally suppress daytime heat while increasing flood risk |
| Southern Plains and Texas | Above-normal temperatures favored; monthly precipitation signal varies by subregion | Emergency HVAC, capacitor/compressor failures, electrical demand, drought-related landscape and fire concerns | Do not infer a continuous month-long heat wave from the monthly category |
| Gulf Coast and Southeast | Above-normal temperatures favored; Atlantic peak-season exposure continues | Cooling demand, humidity and condensate issues, roof readiness, generator/electrical work, water and mold response | Atlantic basin is forecast below normal, but no seasonal product predicts landfall |
| Central Plains, Ohio Valley and central Mississippi Valley | Temperature signal mixed; slight tilt toward above-normal precipitation | Sump pumps, sewer backups, basement water, foundation drainage, electrical and HVAC replacement after flooding | Antecedent saturation can matter more than monthly totals for a single event |
| Midwest and western Great Lakes | Equal-chance temperatures; western Great Lakes lean drier | Ongoing derecho, tornado and flood repairs; roofing, siding, trees, electrical, water and structural work | Recovery demand comes from documented summer events, not the monthly dry signal |
| Northeast and Mid-Atlantic | Equal-chance monthly temperatures; September 5-18 leans drier | Ongoing flood recovery in eastern New York/western New England, plus normal severe-weather and tropical-remnant contingency planning | A drier two-week mean does not eliminate isolated heavy rain or a tropical system |
| Pacific Northwest and West Coast | Above-normal temperatures favored in many inland areas; Pacific Northwest leans drier | Cooling, wildfire smoke/IAQ, filter replacement, duct cleaning, electrical and property hardening | Coastal temperatures have weaker warm odds than inland areas |
| Alaska and Hawaii | Southeast Alaska leans warm; Hawaii favors warm and wet during September 5-18 | Cooling and ventilation, moisture control, roofing and tropical-readiness work | Island and Alaska impacts depend heavily on shorter-range forecasts |
HVAC outlook: September may not behave like a normal shoulder month
The strongest business signal in the outlook is continued cooling demand.
The U.S. Energy Information Administration expects the country to record roughly 1,200 cooling degree days from June through September, about 2% more than summer 2025 and 1% above the 10-year average. For the third quarter alone, EIA expects 4% more cooling degree days than the same quarter last year.
Cooling degree days are an energy-demand measure, not a direct forecast of service calls. Still, the combination of a warmer national third quarter, a warm September signal in major Sun Belt and western markets, and equipment that has already operated through summer supports planning for another period of after-hours no-cool calls, weak capacitors, compressor stress, refrigerant diagnostics, drain and condensate issues, indoor-air-quality complaints and electrical coordination.
The practical mistake would be pulling technicians off cooling coverage too early because the calendar says fall. The better approach is a market-by-market transition plan tied to local seven-day forecasts, call volume, equipment age and part usage.
HVAC preparation checklist for September
- Keep late-day and weekend no-cool coverage active in warm-signal markets until local demand actually falls.
- Review August consumption of capacitors, contactors, fan motors, condensate pumps, drain-treatment supplies and common compressor-protection components before reducing inventory.
- Segment maintenance marketing by climate: cooling performance and IAQ in hot/smoke markets; heating readiness in cooler northern markets.
- Build a heat-safety plan for attic, rooftop and outdoor work, including hydration, acclimatization, work-rest cycles and escalation criteria.
- Coordinate with electrical partners for overloaded disconnects, panels, generators, surge damage and storm-related service issues.
- Prepare smoke-season scripts and stock appropriate filtration products without making unsupported health claims.
- Use weather-triggered scheduling rules cautiously; monthly outlooks should never override a local warning, outage or customer safety issue.
Roofing and storm restoration: a quieter Atlantic is not a zero-work forecast
NOAA’s August update assigns a 75% probability to a below-normal Atlantic hurricane season, with a likely range of 7-13 named storms, 2-6 hurricanes and 0-2 major hurricanes for the full season. Those ranges include activity that had already occurred when the forecast was issued.
That headline can be misleading for a contractor making September plans. NOAA explicitly says the seasonal outlook is not a landfall forecast, and most remaining Atlantic activity is expected during August, September and October. A below-normal basin can still produce one high-impact landfall, tropical-storm flood event or damaging remnant system.
The eastern Pacific has the opposite background signal. NOAA favors an above-normal season with 15-22 named storms, 9-14 hurricanes and 5-9 major hurricanes. The central Pacific is also favored above normal, with 5-13 tropical cyclones of at least tropical-depression strength. That matters directly for Hawaii and Mexico/Baja, and indirectly when tropical moisture contributes to Southwest rainfall.
Roofers and restoration companies should therefore monitor actual storm formation and steering—not simply the seasonal storm count. For continental U.S. operators, the National Hurricane Center, Weather Prediction Center and local National Weather Service offices become the decision sources once a system exists.
2026 tropical-season planning signals
| Basin | NOAA seasonal signal | Peak window | Contractor interpretation |
|---|---|---|---|
| Atlantic | 75% below normal; 7-13 named storms, 2-6 hurricanes, 0-2 major hurricanes | August-September-October | Lower basin activity does not remove Gulf or Atlantic Coast landfall, flood, wind or remnant risk |
| Eastern Pacific | 70% above normal; 15-22 named storms, 9-14 hurricanes, 5-9 major hurricanes | July-August-September | Watch Mexico/Baja impacts and moisture pathways into Arizona, California, Nevada, New Mexico and the Rockies |
| Central Pacific | Above normal favored; 5-13 named storms and tropical depressions combined | July-August-September | Hawaii contractors should maintain tropical wind, roofing, electrical, generator and water-intrusion readiness |
Flood and water-restoration outlook: watch both new rain and unfinished summer recovery
The western wet signal is operationally important because September can still produce short-duration, high-intensity monsoon rainfall. Desert and mountain communities can move from extreme heat to flash flooding quickly, especially around washes, low-water crossings, steep terrain and wildfire burn scars.
The central United States presents a different problem: antecedent saturation. The August 18 U.S. Drought Monitor summary reported a broad band of heavy rain from Nebraska through Iowa, Illinois, Indiana, Ohio and West Virginia. Central Illinois and Indiana received more than 5 inches in many locations, and parts of eastern Indiana received more than a foot. Even when September totals finish near normal, an additional storm over saturated ground can produce outsized basement, drainage, sewer, foundation and electrical impacts.
For restoration contractors, the demand sequence is rarely just extraction. It can include moisture mapping, controlled demolition, drying, antimicrobial protocols, contents handling, HVAC and duct assessment, electrical safety, plumbing repairs, insulation, drywall, flooring, grading and reconstruction. Companies should establish referral and documentation workflows before a surge rather than trying to assemble them after the first hundred calls.
Recent repair and rebuilding zones carrying work into September
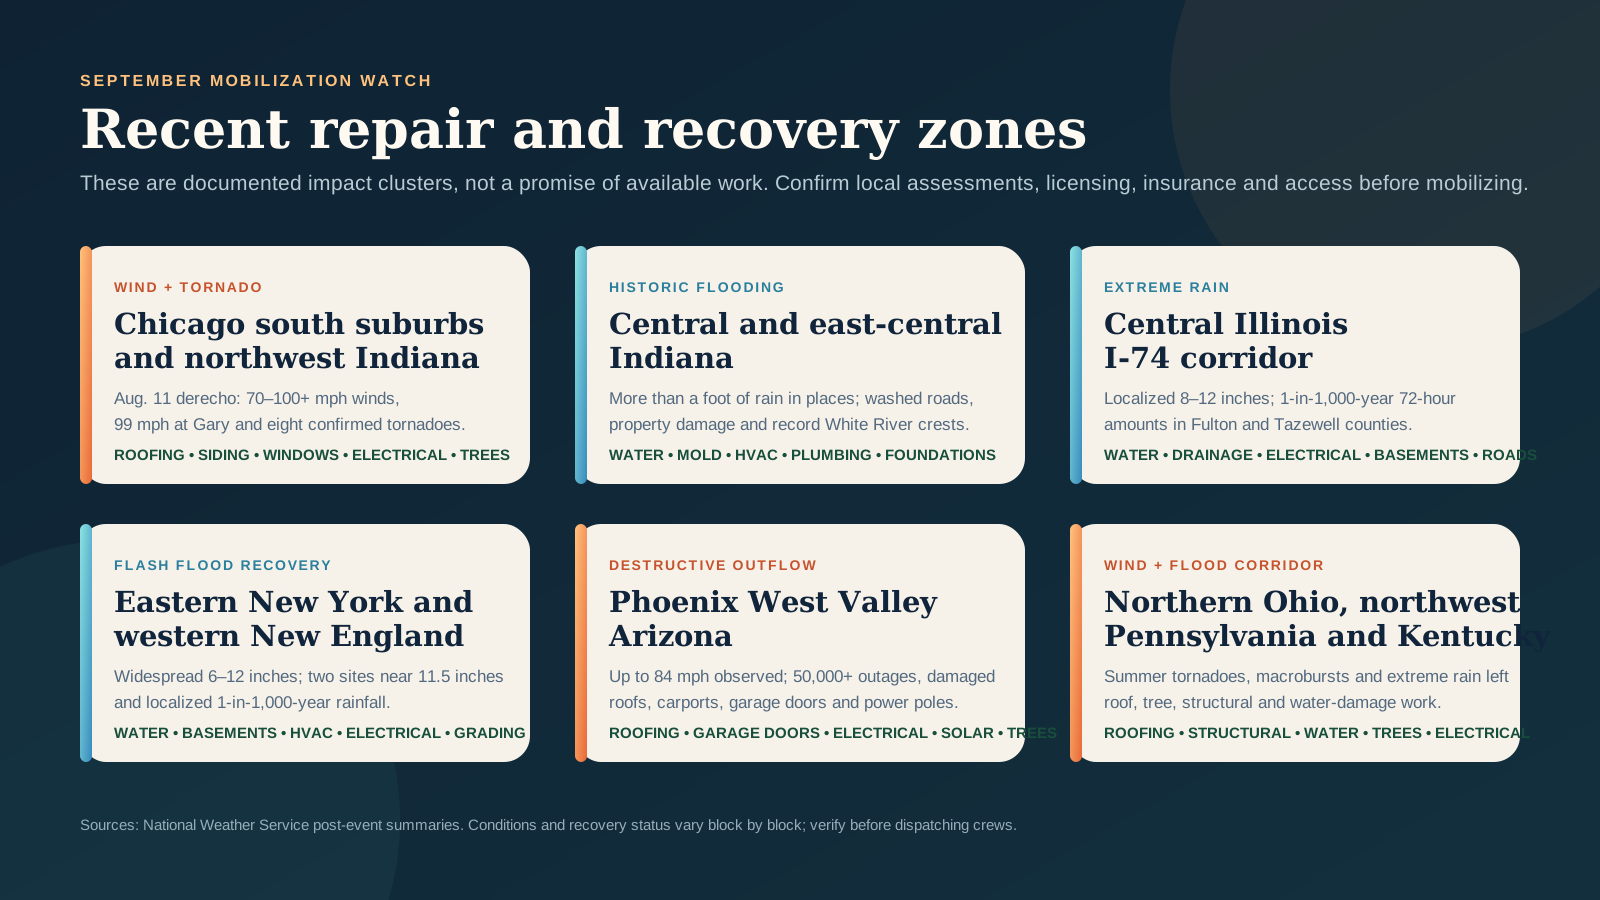
Documented impact clusters and the trades most likely to remain involved
| Area | Recent event evidence | Likely continuing trades | What to verify before mobilizing |
|---|---|---|---|
| South and southwest Chicago suburbs; northwest Indiana | August 11 derecho produced widespread 70 to locally 100+ mph winds, a 99 mph gust at Gary and eight confirmed tornadoes in the NWS Chicago area | Roofing, siding, windows, garage doors, tree removal, electrical, commercial roofing and structural assessment | Damage-assessment status, permits, insurer access, local solicitation rules, lodging and debris-disposal capacity |
| Central and east-central Indiana | August 11-17 brought more than a foot of rain in places, rescues, washed roads, property damage and record White River crests at Anderson and Noblesville | Water mitigation, mold, HVAC, electrical, plumbing, foundations, grading, flooring and reconstruction | Road access, municipal inspections, electrical re-energization, contamination and river-stage conditions |
| Central Illinois, especially the I-74 corridor | August 13-15 produced localized 8-12 inch totals and 1-in-1,000-year 72-hour rainfall estimates in parts of Fulton and Tazewell counties | Water removal, basement systems, drainage, electrical, plumbing, drywall, flooring and road/culvert work | Active flood stages, contaminated water, public-infrastructure closures and county-specific permit requirements |
| Eastern New York and western New England | July 28-30 produced widespread 6-12 inch rainfall, 11.79 inches at Schodack and 11.47 inches at Kinderhook, with localized 1-in-1,000-year rainfall | Water restoration, basements, HVAC, electrical, foundations, drainage, roofing and reconstruction | Whether properties have completed drying, engineering review, insurance documentation and mold assessment |
| Phoenix West Valley, Arizona | August 9 storms produced 70-80 mph radar-estimated winds, an 84 mph observed gust, more than 50,000 outages and damage to roofs, carports, garage doors and power poles | Roofing, garage doors, electrical, solar, trees, fencing, carports and exterior reconstruction | Heat exposure, utility clearance, roof-access safety, licensing and availability of matching materials |
| Northern Ohio and northwest Pennsylvania | Summer events included 10-15 inches of rain on Kelleys Island, flash flooding, an EF1 tornado, a 90 mph macroburst, four Crawford County tornadoes and more than 150,000 outages in a separate June event | Water restoration, roofing, siding, trees, electrical, foundations and structural repairs | Event-specific damage boundaries, insurer scope, lake/island logistics and local inspection requirements |
| Central and northern Kentucky / Ohio River corridor | June events included an EF2 near Maysville with roof and structural damage, 80-85 mph straight-line wind damage in Pendleton County and major flash flooding across southern Indiana and central Kentucky | Roofing, barns/outbuildings, structural framing, water mitigation, electrical, trees, foundations and reconstruction | Emergency-declaration status, access, rural logistics, licensing reciprocity and the difference between temporary and permanent repairs |
Wildfire, smoke and post-fire rain: September begins with national resources stretched
The National Interagency Fire Center reported National Preparedness Level 5 on August 24, with 79 large fires being suppressed, 22,122 personnel assigned and approximately 7.74 million acres burned year to date. The Northwest was the only geographic area at Preparedness Level 5 in the August 23 coordination snapshot.
For home service contractors, wildfire exposure extends beyond flames. Smoke can drive filtration, indoor-air-quality, ventilation and duct-cleaning requests. Power shutoffs and damaged distribution systems can produce generator and electrical work. Burned roofs, siding, windows, insulation and mechanical systems can require reconstruction.
Rain creates a second phase of risk. Burn scars can shed water, ash, sediment and debris much faster than unburned terrain. A wetter Southwest/Rockies signal can therefore produce localized debris-flow and access problems near recently burned watersheds even while the broader fire season continues.
Contractors should avoid marketing fear. Use local air-quality measurements, evacuation orders, utility guidance and incident maps, and be precise about what a filter, duct service or building repair can and cannot accomplish.
Wildfire-related home service demand pathways
| Exposure | Possible contractor work | Primary operating risk |
|---|---|---|
| Smoke and ash | Filter replacement, IAQ assessment, duct and equipment cleaning, building-envelope inspection | Unsupported health claims, cross-contamination and work during unsafe air-quality conditions |
| Utility interruption | Generators, transfer equipment, electrical inspection, surge damage and HVAC restart | Backfeed, fuel storage, unpermitted work and utility coordination |
| Direct structure damage | Roofing, siding, windows, insulation, mechanical/electrical replacement and reconstruction | Unsafe structures, hazardous debris, insurance scope and site access |
| Post-fire rainfall | Drainage, water diversion, cleanup, foundation and exterior repairs | Flash flooding, debris flows, road closures and rapidly changing warnings |
A 30-day operating plan for weather-sensitive contractors
Build the response system before the alert
- Assign one person to review CPC, NWS, NHC, WPC, SPC, NIFC and local emergency information on a fixed schedule rather than relying on social-media screenshots.
- Create region-specific activation thresholds for extra call takers, after-hours technicians, water crews, roof tarping, generators and subcontractor capacity.
- Pre-negotiate lodging, fuel, dumpsters, drying equipment, common roofing materials, temporary power and specialty subcontractors before entering a disaster market.
- Verify state and local licensing, registration, insurance, solicitation, contract, permitting and emergency-pricing requirements before sending crews across a jurisdictional line.
- Use geofenced intake and qualification so the office can separate immediate life-safety issues, emergency stabilization, insurance work and normal service calls.
- Document the existing condition, weather source, customer authorization, moisture readings, equipment serials, photos, temporary work and scope changes from the first visit.
- Set a clear policy against self-dispatching crews into active warnings, evacuation zones, flooded roads, wildfire closures or areas where utilities have not declared conditions safe.
- Prepare customer messaging that distinguishes inspection, temporary stabilization and permanent repair and avoids promising insurance coverage or claim outcomes.
- Track parts, labor and subcontractor constraints daily; weather demand is only profitable when the company can finish work safely and support warranties.
- Review the final NOAA monthly update on August 31 and replace monthly assumptions with shorter-range forecasts as September unfolds.
What this outlook does not say
Probability is not a job map
A monthly climate outlook does not forecast an exact temperature, heat-wave start date, tornado outbreak, hail swath, hurricane landfall, flood crest, wildfire perimeter or number of service calls.
A recent damage report also does not establish that a market has unmet private-contractor demand. Recovery may be complete in some blocks and only beginning in others.
Use this report to decide where to increase monitoring, confirm capacity and prepare contingencies. Use local warnings, emergency-management information, field verification, permits, customer authorization and safe access to decide whether to dispatch.
September 2026 weather outlook FAQ for contractors
Will September 2026 be hotter than normal in the United States?
NOAA favors above-normal monthly temperatures across the western United States, southern Plains and Southeast. The strongest warm probabilities are in the north-central Rockies and Intermountain West. The Northern Plains, Midwest, Northeast and parts of the Ohio Valley and Mid-Atlantic are in equal chances.
Where is HVAC demand most likely to stay elevated in September 2026?
The clearest climate signal is in the West, southern Plains and Southeast. Local call volume will still depend on actual temperatures, humidity, equipment age, outages and how much cooling demand occurred earlier in the summer.
Where should roofing and storm-restoration contractors watch in September?
Maintain tropical monitoring along the Gulf and Atlantic coasts despite the below-normal Atlantic outlook, and watch Hawaii, Mexico/Baja and Southwest moisture pathways because the eastern and central Pacific are favored more active. Recent documented wind-repair zones also include northern Illinois, northwest Indiana, Phoenix, northern Ohio, northwest Pennsylvania and parts of Kentucky.
Does a below-normal Atlantic hurricane forecast mean no U.S. landfall?
No. NOAA states that its seasonal outlook is not a landfall forecast. September is a peak hurricane month, and a single storm can create major wind, flood, electrical and rebuilding impacts even in a below-normal season.
Where is September flood risk elevated?
The monthly outlook favors wetter conditions across much of the West and slightly wetter conditions in the Ohio Valley, Central Plains and central Mississippi Valley. Flash-flood risk depends on individual storms, terrain, saturation, drainage and burn scars, so local WPC and NWS forecasts are essential.
What recent U.S. markets still have weather-recovery activity entering September?
Documented summer impact clusters include northern Illinois and northwest Indiana, central Illinois, central and east-central Indiana, eastern New York and western New England, the Phoenix West Valley, northern Ohio, northwest Pennsylvania and parts of Kentucky. Contractors must verify current local needs and legal requirements rather than assuming work remains available.
How often should contractors update this September weather plan?
Review the final CPC monthly outlook on August 31, then use seven-day forecasts and official hazard products for staffing and deployment. Tropical and severe-weather decisions should shift to event-specific guidance as soon as a system forms.
Methodology
TradeVulcan Dispatch reviewed NOAA Climate Prediction Center monthly and Week 3-4 outlooks, NOAA Atlantic and Pacific hurricane outlooks, EIA cooling-degree-day assumptions, current NIFC wildfire statistics, the U.S. Drought Monitor and National Weather Service post-event summaries. The forecast section distinguishes monthly probability categories from event-specific forecasts. The recovery section identifies documented impact areas but does not estimate remaining private-contractor demand. Source information was current through August 24, 2026; NOAA’s final September monthly outlook is scheduled for August 31.
Sources
- 30-Day Outlook Discussion for September 2026 — NOAA Climate Prediction Center
- Week 3-4 Outlook Valid September 5-18, 2026 — NOAA Climate Prediction Center
- NOAA 2026 Atlantic Hurricane Season Outlook — NOAA Climate Prediction Center
- NOAA 2026 Eastern and Central Pacific Hurricane Outlook — NOAA Climate Prediction Center
- Short-Term Energy Outlook: Economy, Weather and CO2 — U.S. Energy Information Administration
- Current National Wildfire Statistics — National Interagency Fire Center
- National Drought Summary for August 18, 2026 — U.S. Drought Monitor
- August 11, 2026 Derecho Across Northern Illinois and Northwest Indiana — National Weather Service Chicago
- Record Flooding of August 2026 — National Weather Service Indianapolis
- August 12-13, 2026 Flash Flooding — National Weather Service Northern Indiana
- August 13-15, 2026 Flash Flooding Across Central Illinois — National Weather Service Lincoln
- July 28-30, 2026 Significant Flash Flood and Heavy Rain Event — National Weather Service Albany
- August 9, 2026 Major Wind Damage in the Phoenix Area — National Weather Service Phoenix
- July 5-6, 2026 Severe Weather and Flooding — National Weather Service Cleveland
- June 14, 2026 Severe Weather — National Weather Service Cleveland
- June 18, 2026 EF2 Tornado Near Maysville, Kentucky — National Weather Service Wilmington
- Flash Flood and Tornado Event June 26-28, 2026 — National Weather Service Louisville