What QuickBooks adds to Vulcan Score
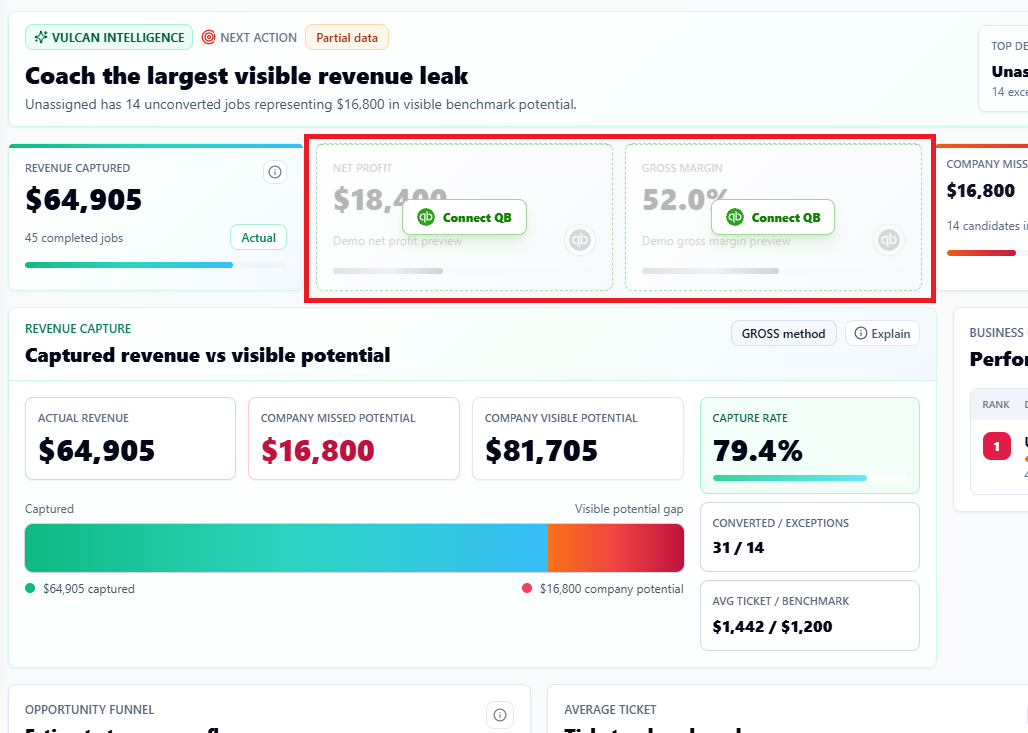
CRM data explains operational activity. QuickBooks explains financial performance. When QuickBooks Online is connected and enabled, Vulcan Score can show gross margin, net profit, and P&L coaching alongside revenue capture and benchmark performance.
If QuickBooks is not connected, Vulcan Score may show preview cards with a Connect QuickBooks action. Those cards are placeholders, not live financial results.
Key financial KPIs
| KPI | Plain-English meaning | What to check |
|---|---|---|
| Gross margin | How much revenue remains after direct costs such as labor, materials, equipment, subcontractors, or cost of goods sold. | Job costing, COGS accounts, materials, labor burden, purchase orders, and revenue classification. |
| Net profit | What remains after direct costs and overhead expenses. | Overhead categories, owner pay, rent, admin payroll, marketing, vehicles, insurance, and debt service treatment. |
| P&L by Class | Profitability by department, trade, location, or operating division. | Class tracking, transaction consistency, and CRM-to-accounting department alignment. |
Why Classes matter
QuickBooks documentation describes Classes as a way to track income, expenses, or profitability by business segment. In a trade company, the most useful segments are usually Service, Sales / Replacement, Install, Maintenance, major trades, and locations.
When Classes match the CRM's Business Units or department map, Vulcan Intelligence can connect operational issues to financial outcomes. For example, a low average ticket in Service and a negative net profit in Install point to very different coaching plans.
Example: company-level P&L hides the issue
| View | Revenue | COGS | Gross profit % | Net profit | What the owner sees |
|---|---|---|---|---|---|
| Company total | $220,000 | $143,000 | 35% | $8,000 | Margins are weak, but the cause is not obvious. |
Example: Classes reveal the operating problem
| Class | Revenue | COGS | Gross profit % | Net profit | Decision |
|---|---|---|---|---|---|
| Service | $120,000 | $48,000 | 60% | $28,000 | Service is healthy and may be carrying the company. |
| Install | $100,000 | $95,000 | 5% | -$20,000 | Install needs pricing, labor, materials, purchasing, or scope control review. |
Recommended Class structure
- Service
- Sales or Replacement
- Install
- Maintenance
- Commercial Service
- Residential Service
- HVAC, Plumbing, Electrical, Roofing, or Drain / Sewer when the company is multi-trade
Best practices before using financial KPIs for rewards
- Review Class usage with your accountant or bookkeeper.
- Confirm revenue and COGS are consistently categorized.
- Decide how overhead is allocated or whether overhead stays company-level.
- Confirm the P&L period matches the Vulcan Score period you are reviewing.
- Use financial KPIs for coaching first. Review carefully before contests or rewards.